
How to build quarterly reports in SEO Gets
Quarterly SEO reports show stakeholders the bigger picture, such as how your organic search performance is trending over time, what's working, and where opportunities lie. In SEO Gets, you can configure a property dashboard with your quarterly date range and settings, then share that view.
Set up your quarterly date range
Start by opening the property you want to report on from your master dashboard. Then set the date range to cover the quarter you're reporting on:
Click the date selector at the top of the dashboard.
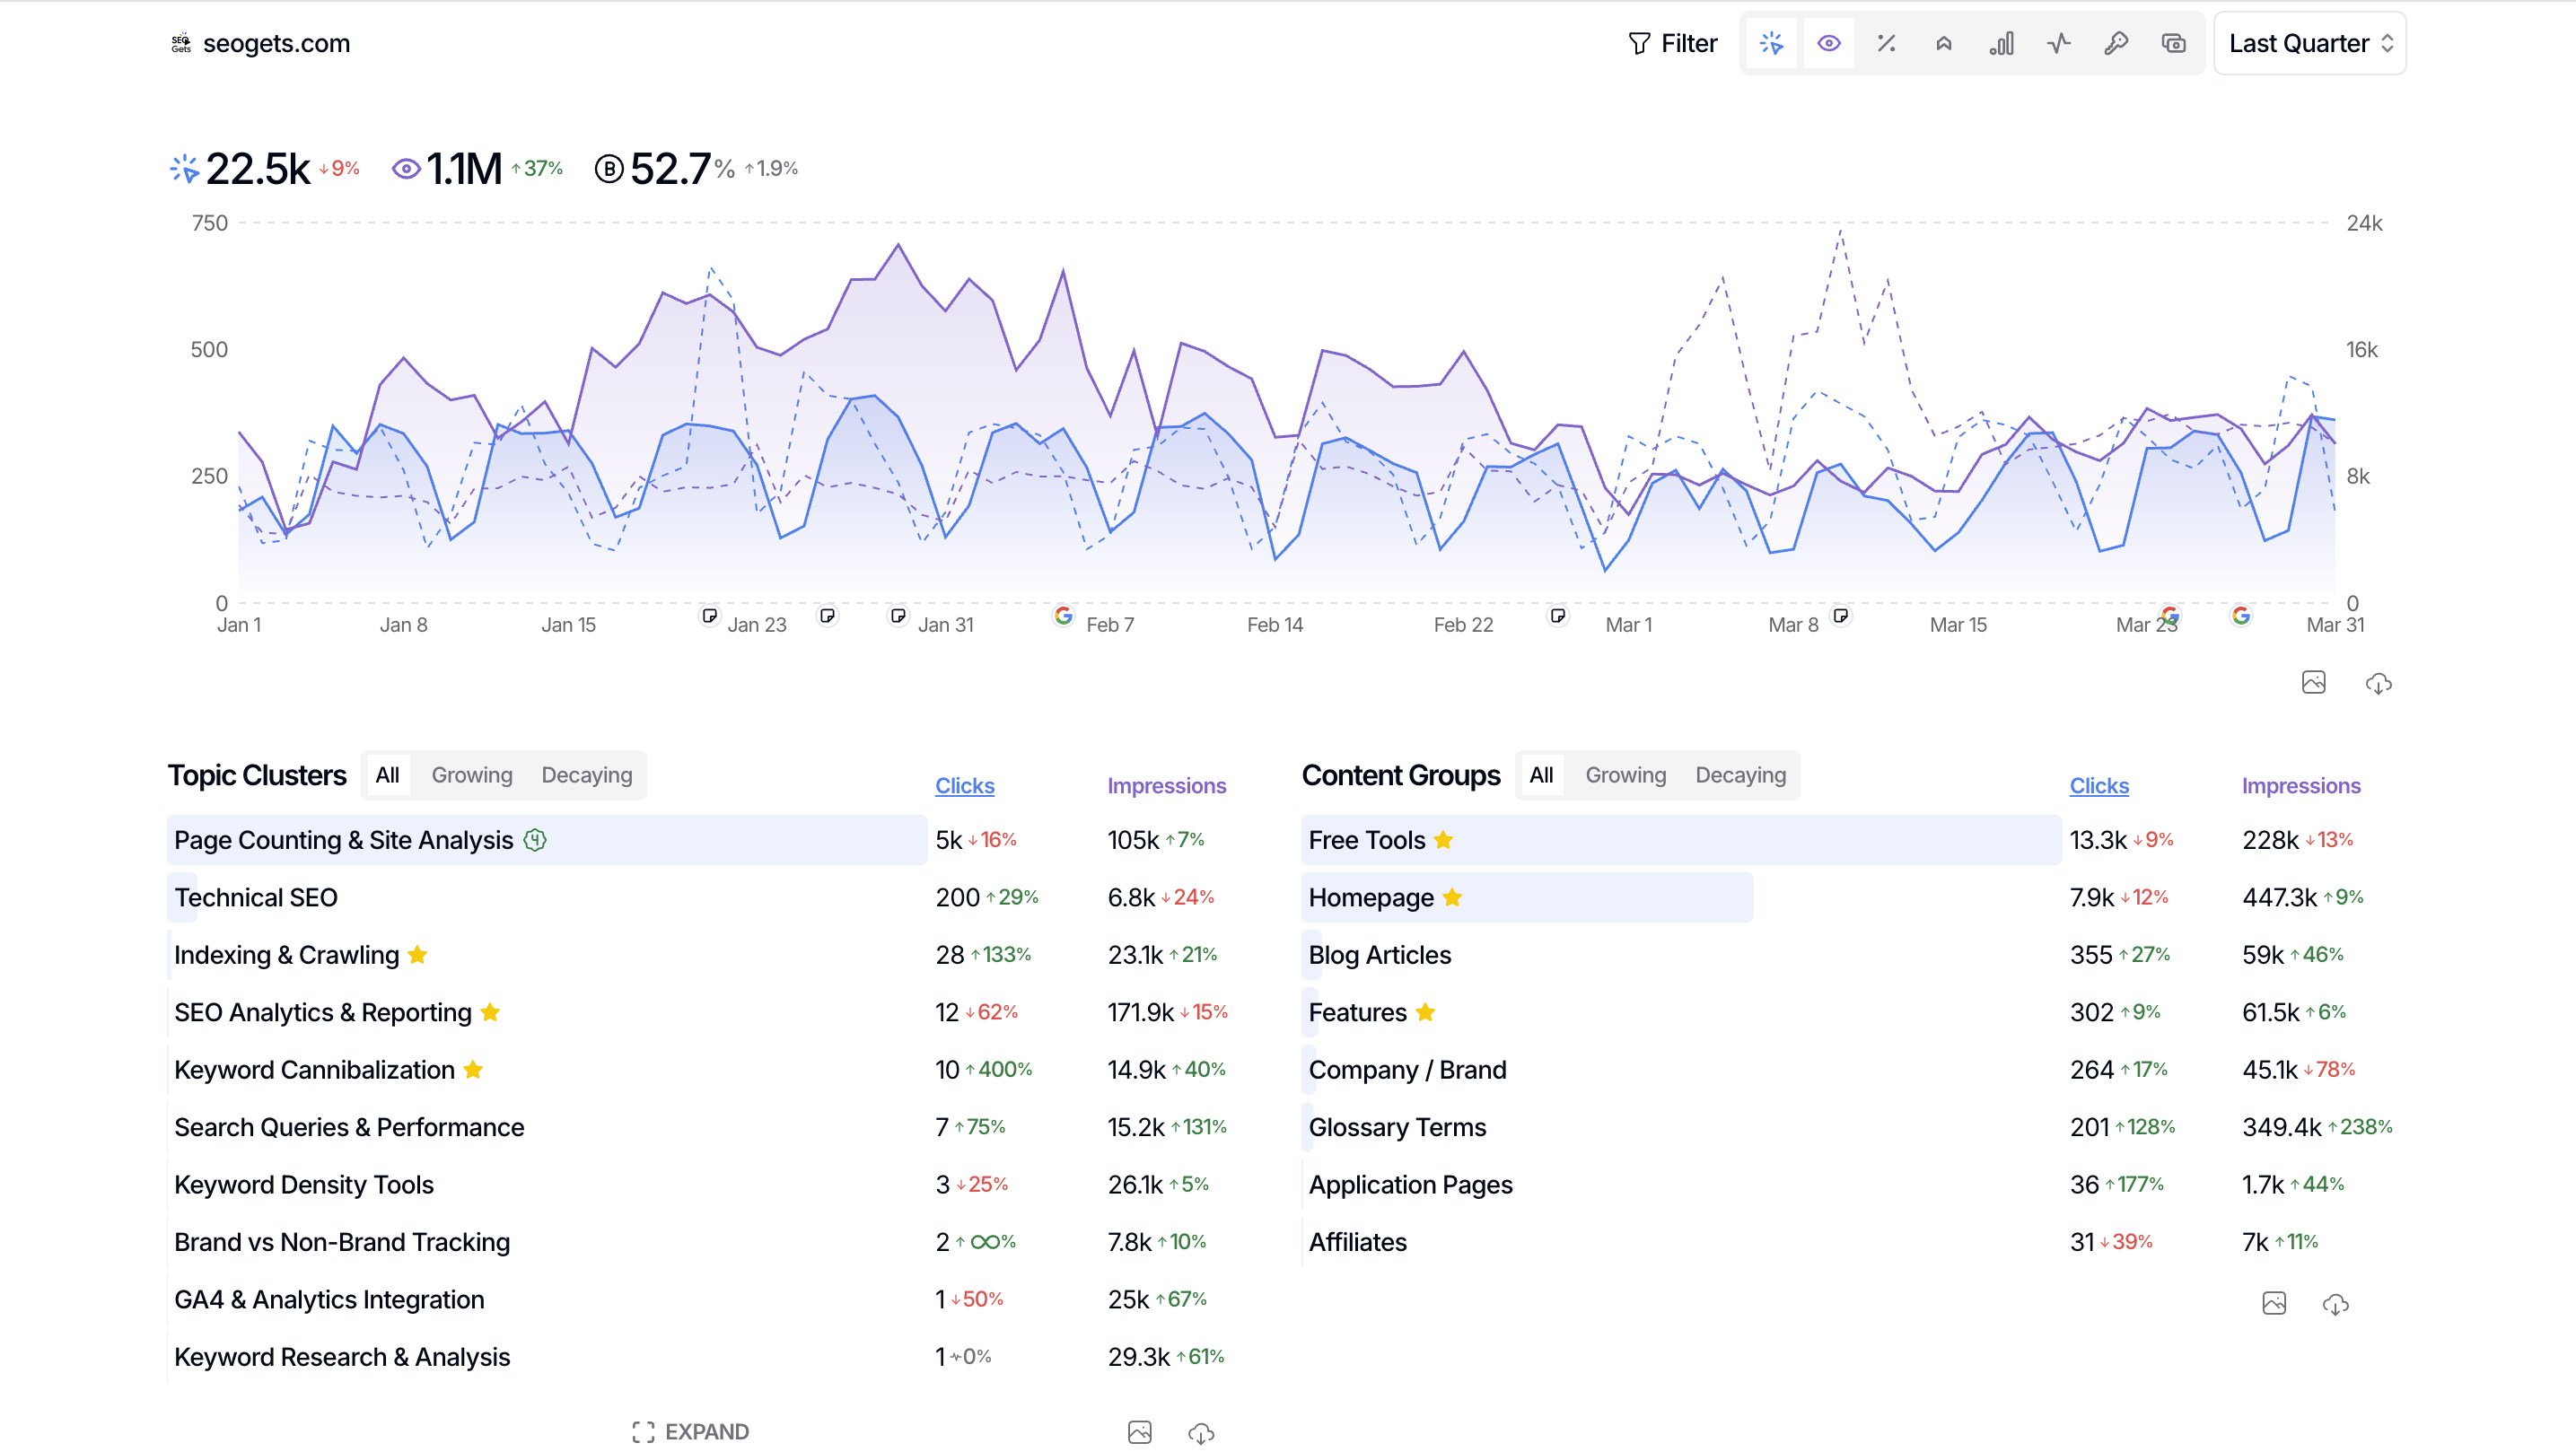
Choose Last Quarter for a complete QoQ analysis
If you need to go further back, choose Custom to select the dates from a different quarter.
Apply the date range.
The dashboard will now show all metrics filtered to your selected quarter. Be sure to enable a comparison period to illustrate growth from quarter to quarter.
Select your metrics
Toggle the metrics you want to include in your report using the icons at the top of the dashboard:
Clicks — Total clicks from Google search results
Impressions — How often your pages appeared in search
Average position — Your average ranking across all queries
CTR — Click-through rate (clicks divided by impressions)
If you've connected GA4, you can also toggle sessions, key events, engagement rate, and revenue to show how organic traffic translates into business outcomes.
Apply filters to focus your report
Use filters to narrow down the data for your quarterly narrative. Available filters include:
Query — Focus on specific keyword themes or exclude branded terms
Page — Report on a specific section of your site (like /blog/ or /products/)
Country — Show performance by geographic market
Device — Compare desktop vs. mobile performance
Branded vs non-branded — See how brand searches compare to organic discovery (requires setting up branded keywords first)
Search type — Filter by web, discover, news, image, or video search (located in the date range selector)
For quarterly reports, filtering by branded vs non-branded is especially useful—it shows stakeholders how much traffic comes from people searching for your brand versus finding you through topical content.
Use report-style views in your dashboard
Once your date range and filters are set, explore these dashboard views to surface insights for your quarterly report:
Topic clusters — See performance across keyword themes. Topic clusters help you show which content areas are growing vs. declining. One-click setup can generate these automatically.
Content groups — Track performance by page sections (like /blog/, /products/, /guides/). Set up content groups in Settings to organize your pages.
New rankings — Show which keywords your site started ranking for during the quarter.
Branded vs non-branded clicks — Break down your traffic sources.
Countries — See which markets drove the most traffic.
Share your quarterly report

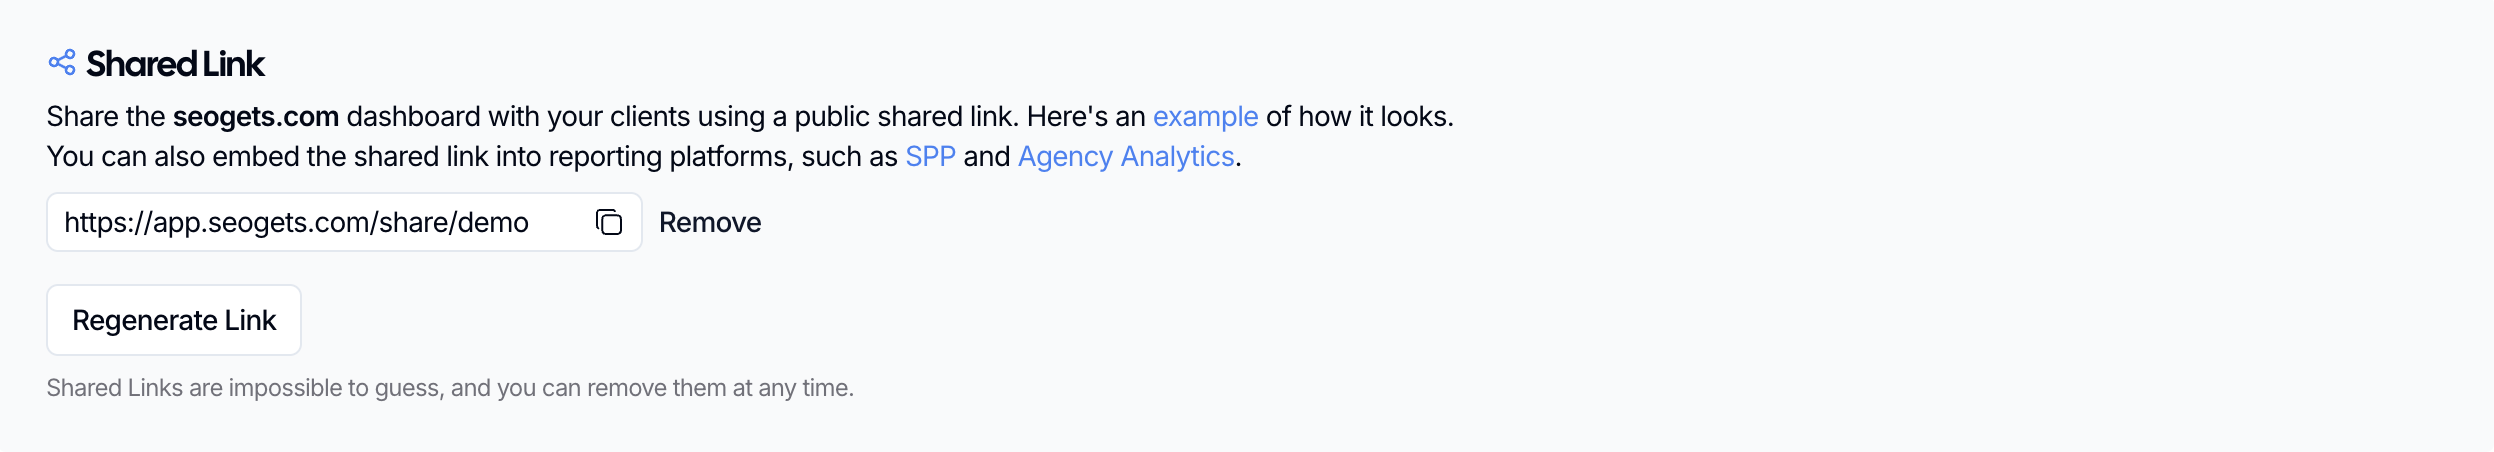
Once your dashboard is configured, share it with stakeholders using Shared Links:
Go to Settings → Shared Link.
Click Generate Link or Regenerate Link if you've updated the dashboard.
Copy the link and send it to your stakeholders.
Recipients can view the configured dashboard but can't access GA4, Indexing, Annotations, Optimize, or Settings pages. They can use filters within the shared view to explore the data themselves.