
Combined portfolio metrics
Combined portfolio metrics let you view the collective performance of multiple sites in one aggregated view. Instead of checking each site individually, you can group related sites and see their combined impressions, clicks, and query counts together.
How it works
Combined portfolio metrics use tags to group sites, then apply a filter on your Master Dashboard. When you filter by tag, the dashboard shows aggregated data for all sites with that tag.
This is useful when you manage multiple sites that belong to the same client, market, or project and want to answer questions like "How did all client sites perform this month?" or "How was performance impacted by our site migration?"
Create a combined portfolio view
Tag your sites. Apply the same tag to every site you want to group together. For example, tag all sites belonging to one client with the client's name. See Create & assign tags for details.

Filter your Master Dashboard. At the top of the Master Dashboard, select the tag you want to view. The dashboard updates to show combined metrics for all sites with that tag.

Review the aggregated data. You'll see grouped impressions, clicks, and query counts for the entire portfolio—not per-site breakdowns.
When to use combined portfolio metrics
This feature is helpful any time you want to see how a group of sites is performing as a whole. Common use cases include:
Client portfolios: Review total performance for all sites under one client account.
Site migrations: Track combined metrics before and after a migration to measure overall impact.
International subdomains: View aggregate performance across country-specific sites.
Site type groups: Compare performance across all ecommerce sites, local service sites, or blog networks.
Tags are user-specific, so your portfolio groups won't affect teammates. Each person can set up the tags that match their own workflow.
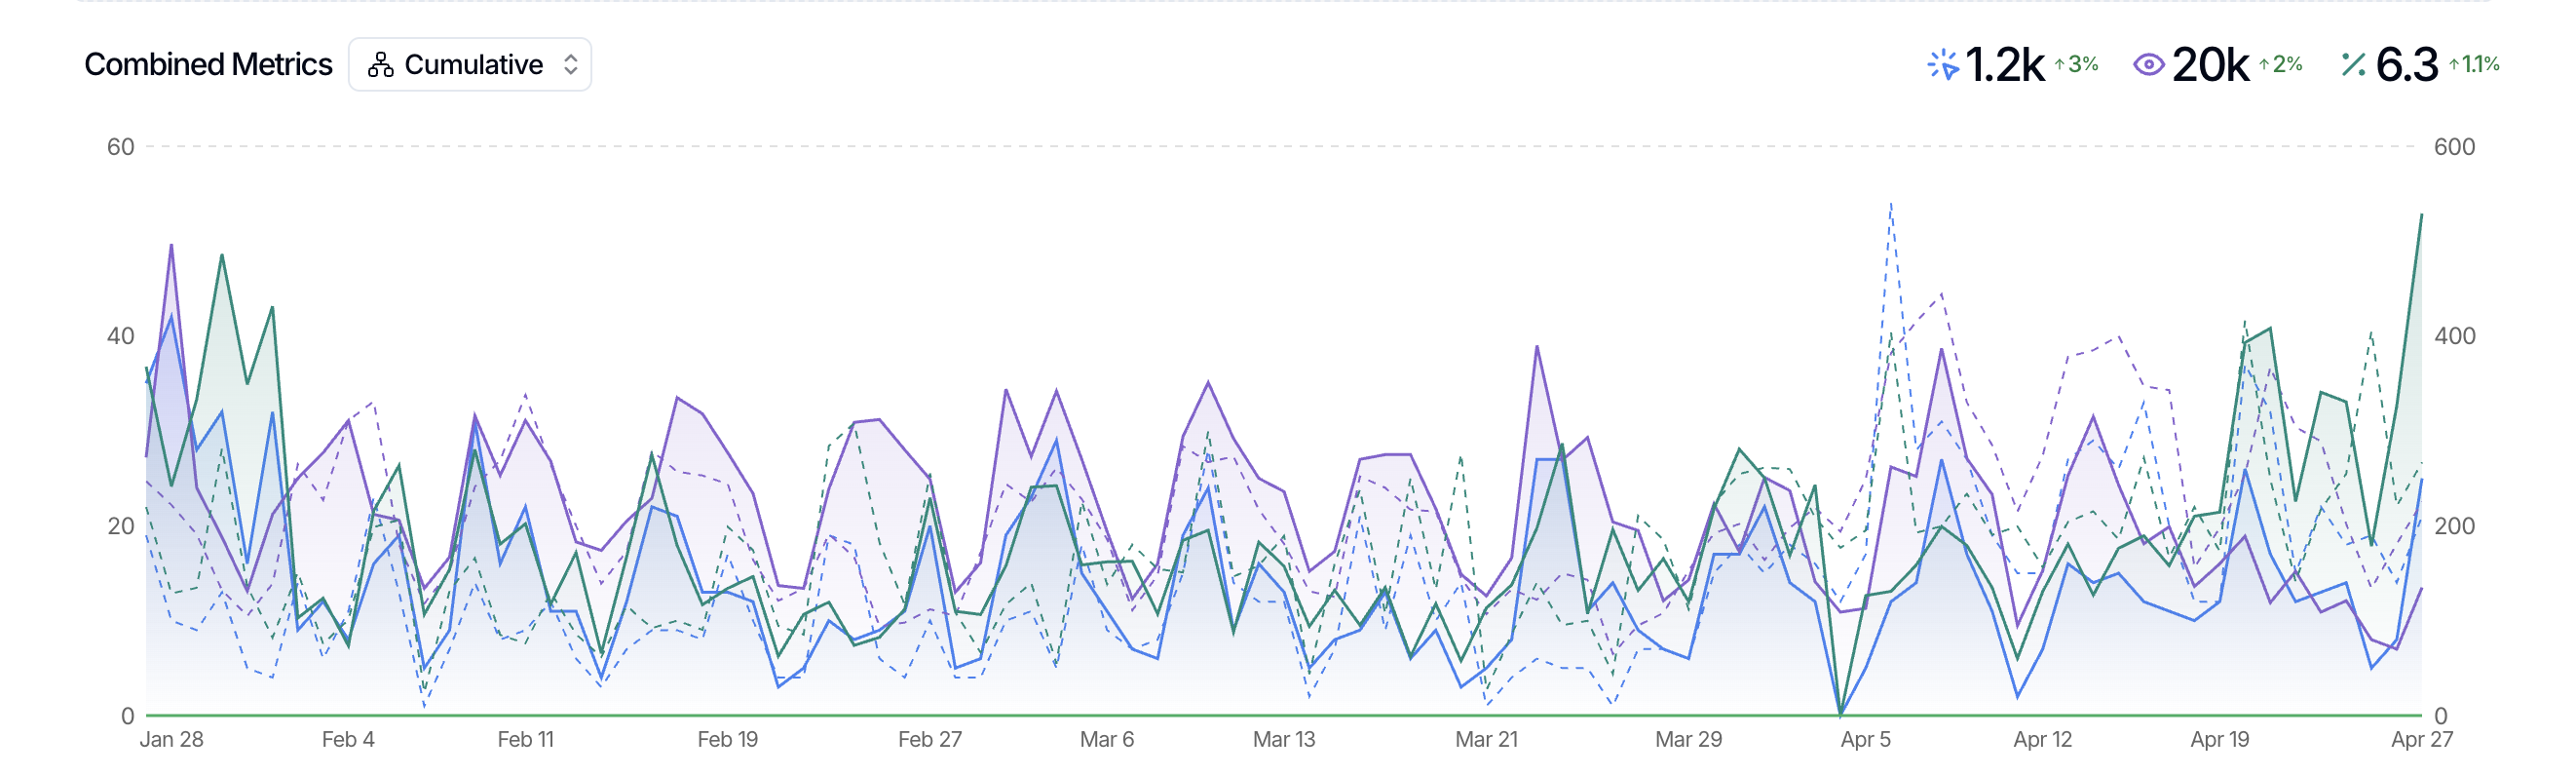
Compare performance across multiple sites
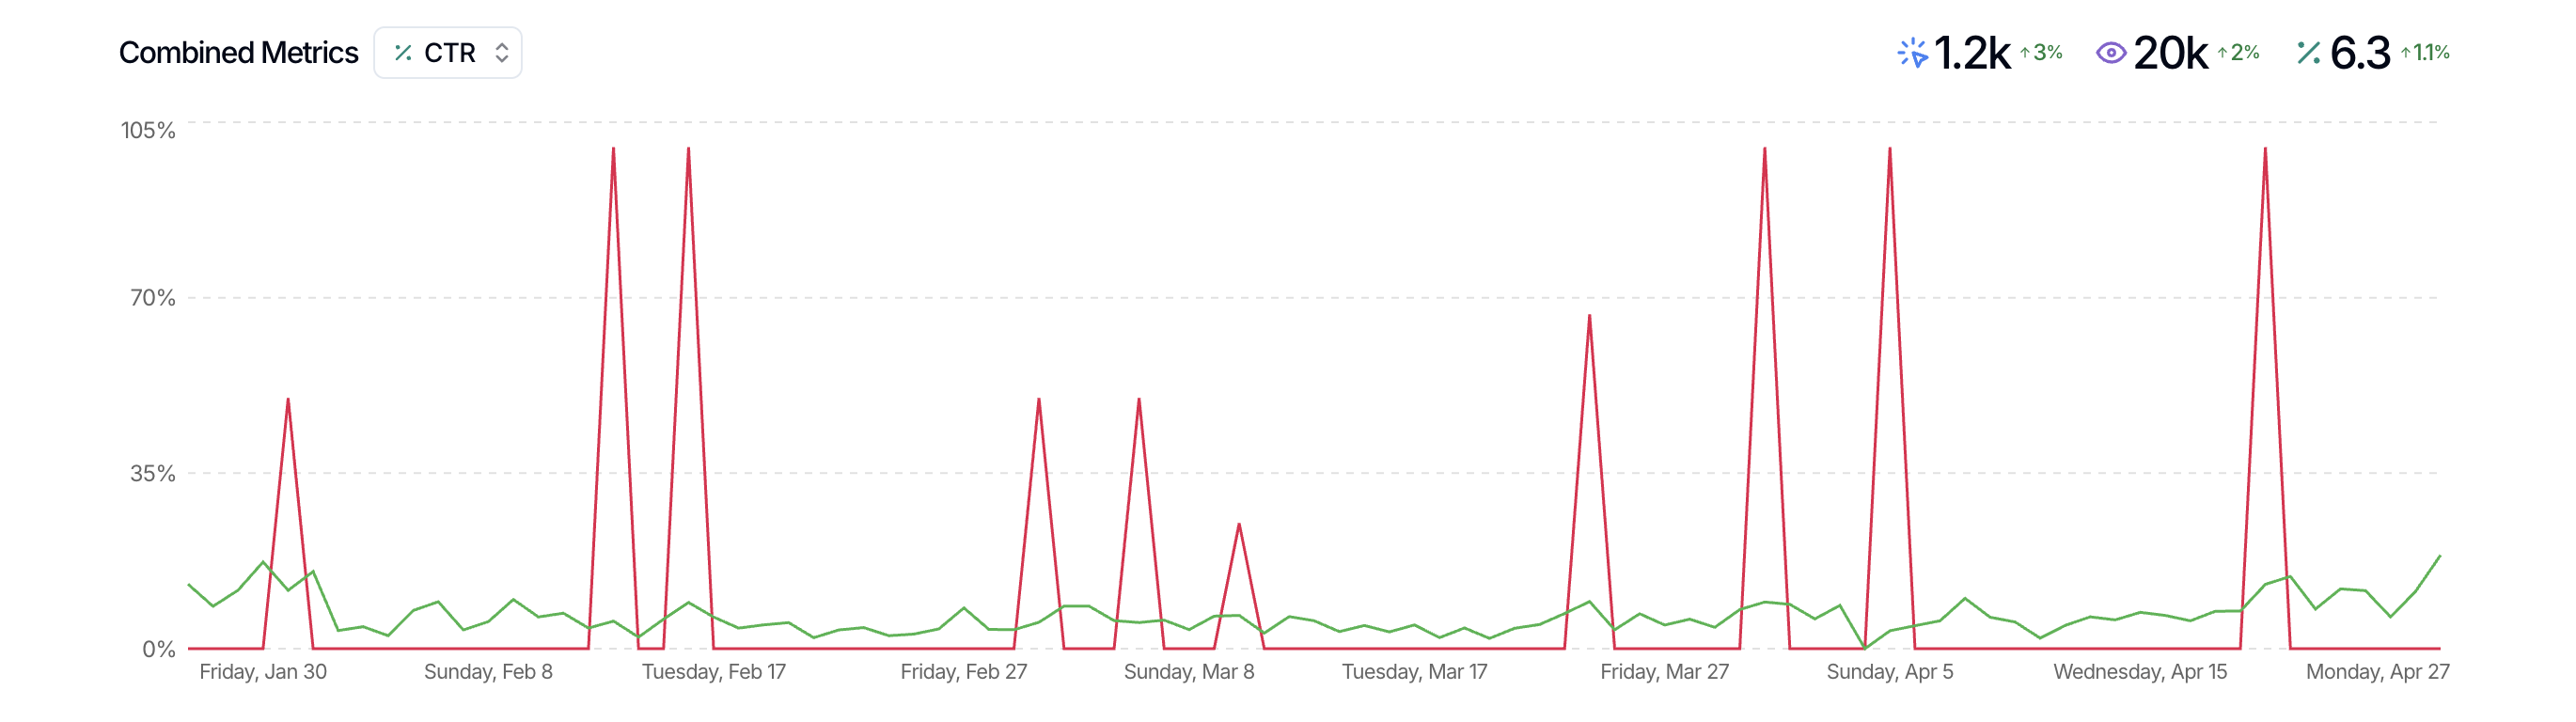
If you click on the selector next to Combined Metrics, you can split out individual property data acrosys clicks, impressions, CTR, and position. This allows you to compare the performance of multiple sites within a single view, unifying your data in a unique way to help you understand how sites with similar characteristics compare.
Combined Metrics is a great way to surface insights that can be used for case studies, LinkedIn posts, industry insights, and more.
What's next
Once you've created a portfolio view, you can adjust the date range, search type, or other filters just like you would on the main Master Dashboard. If you want to go deeper into individual site performance, just remove the tag filter to return to the full property list.
For more on personalizing your view, see Personalize master dashboard. For a practical example of using tags for multi-site tracking, see Track site migrations in SEO Gets.