Content Decay Heatmap
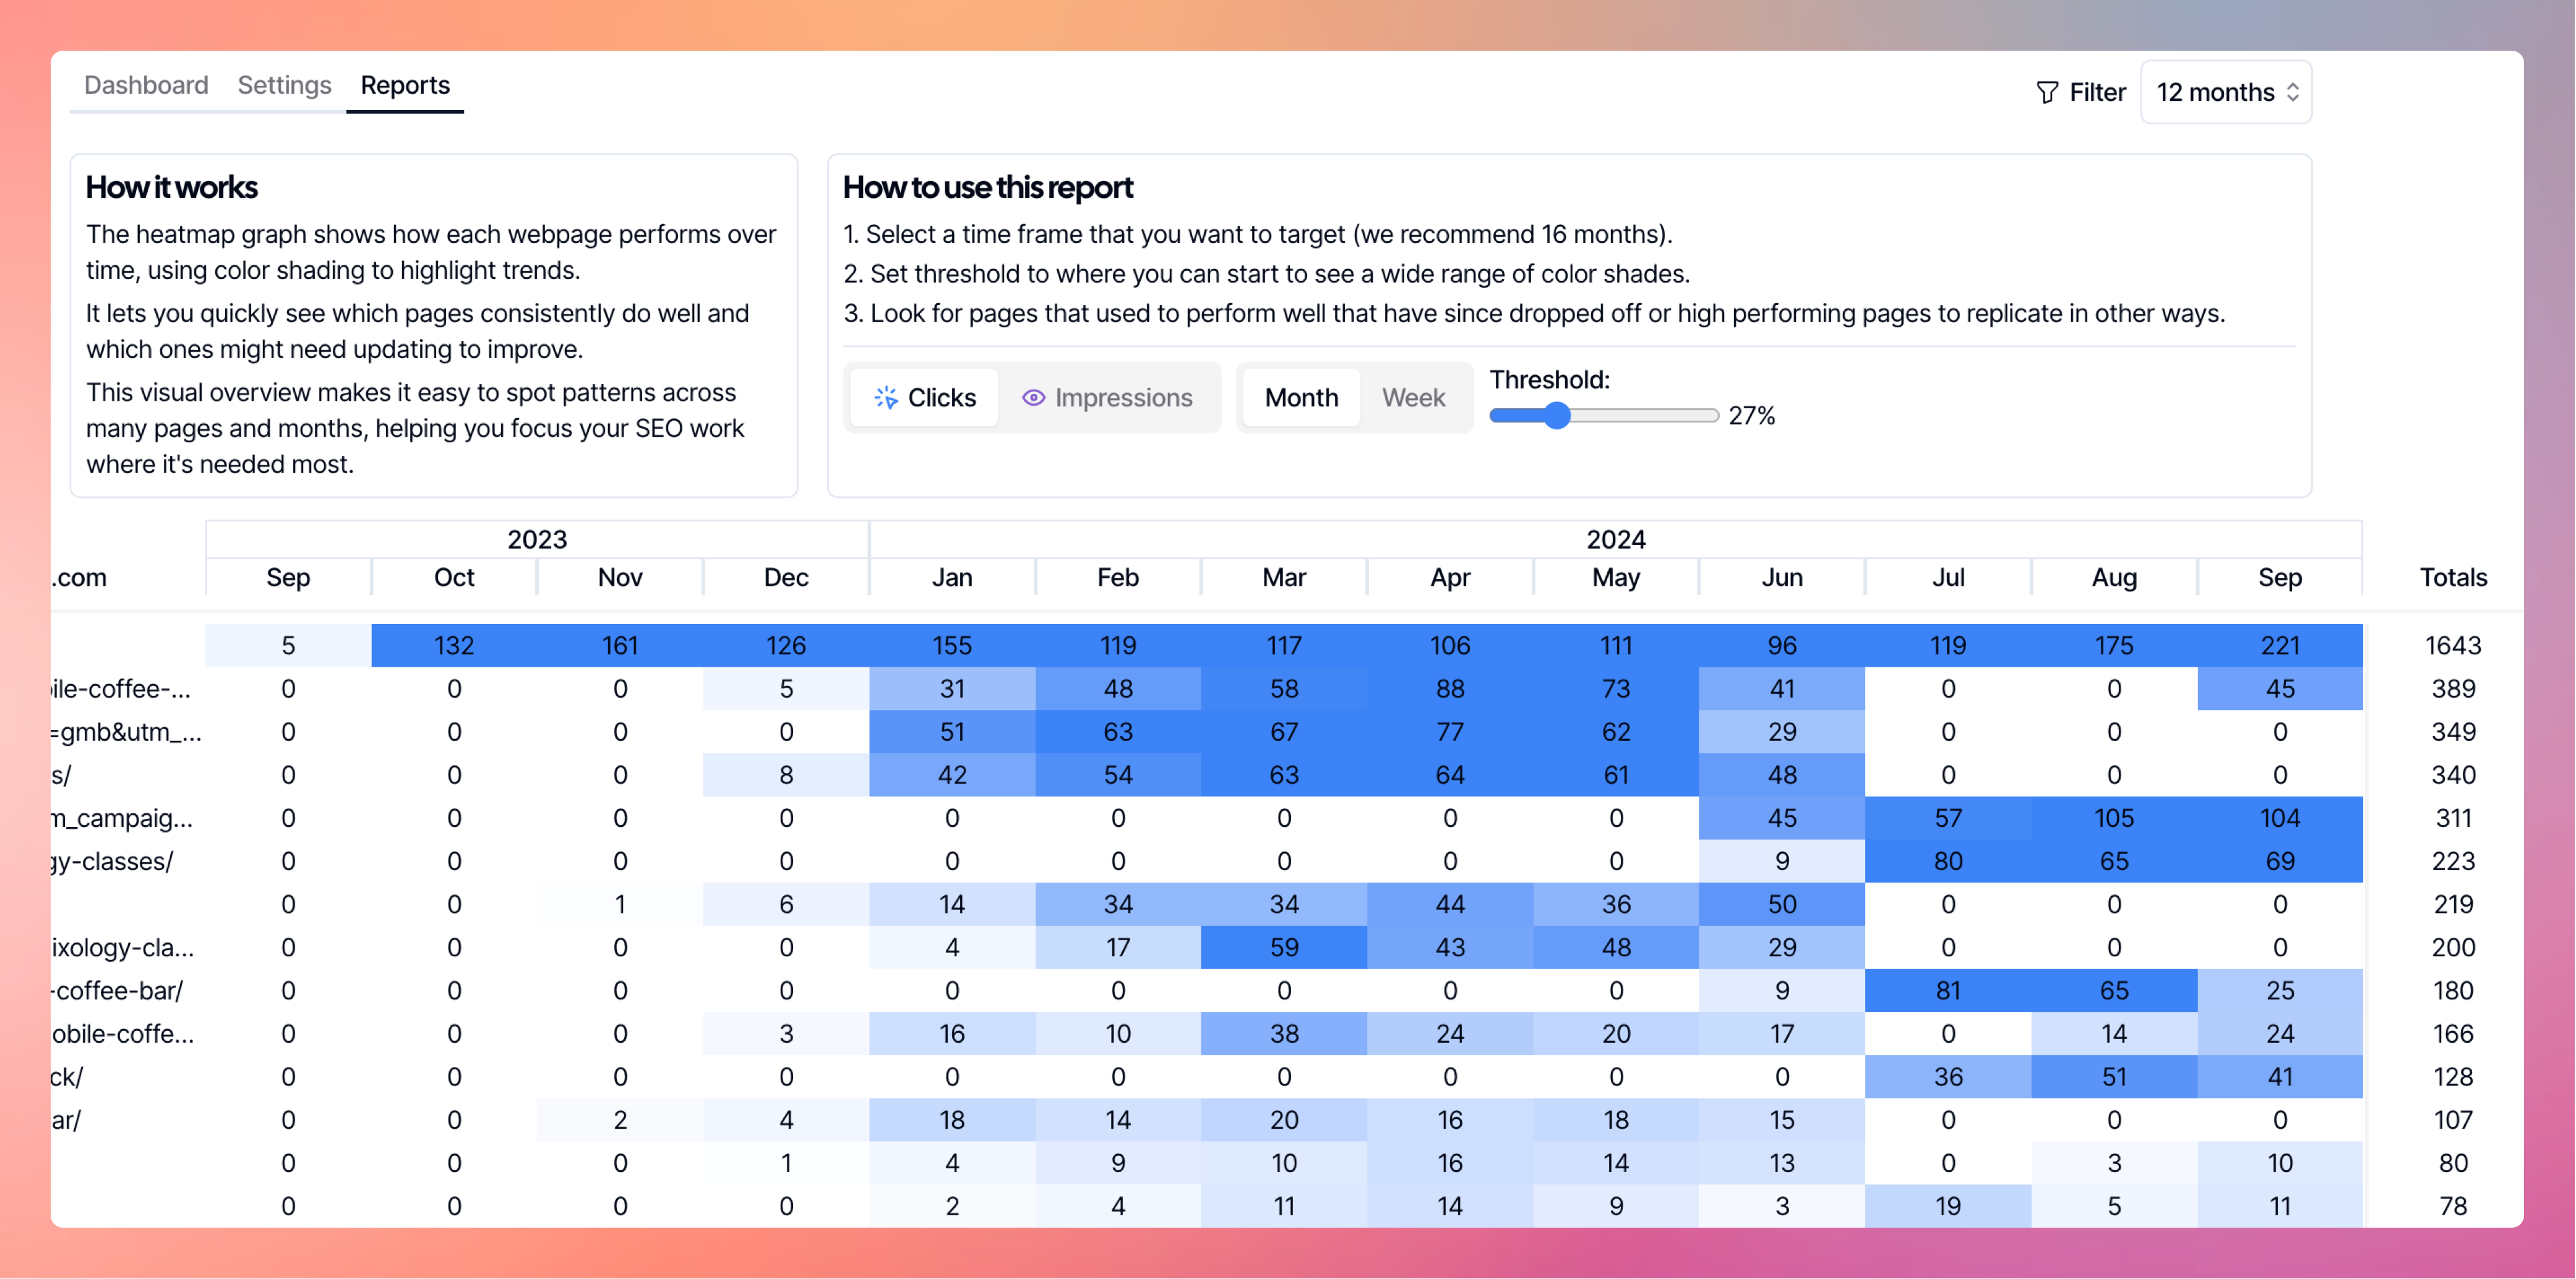
The heatmap graph shows how each webpage performs over time, using color shading to highlight trends. It lets you quickly see which pages consistently do well and which ones might need updating to improve.

But first, why even use a heatmap overview?
The heatmap graph shows how each webpage performs over time, using color shading to highlight trends.
It lets you quickly see which pages consistently do well and which ones might need updating to improve.
This visual overview makes it easy to spot patterns across many pages and months, helping you focus your SEO work where needed most.
How to use SEO Gets to find striking distance keywords quickly and easily.
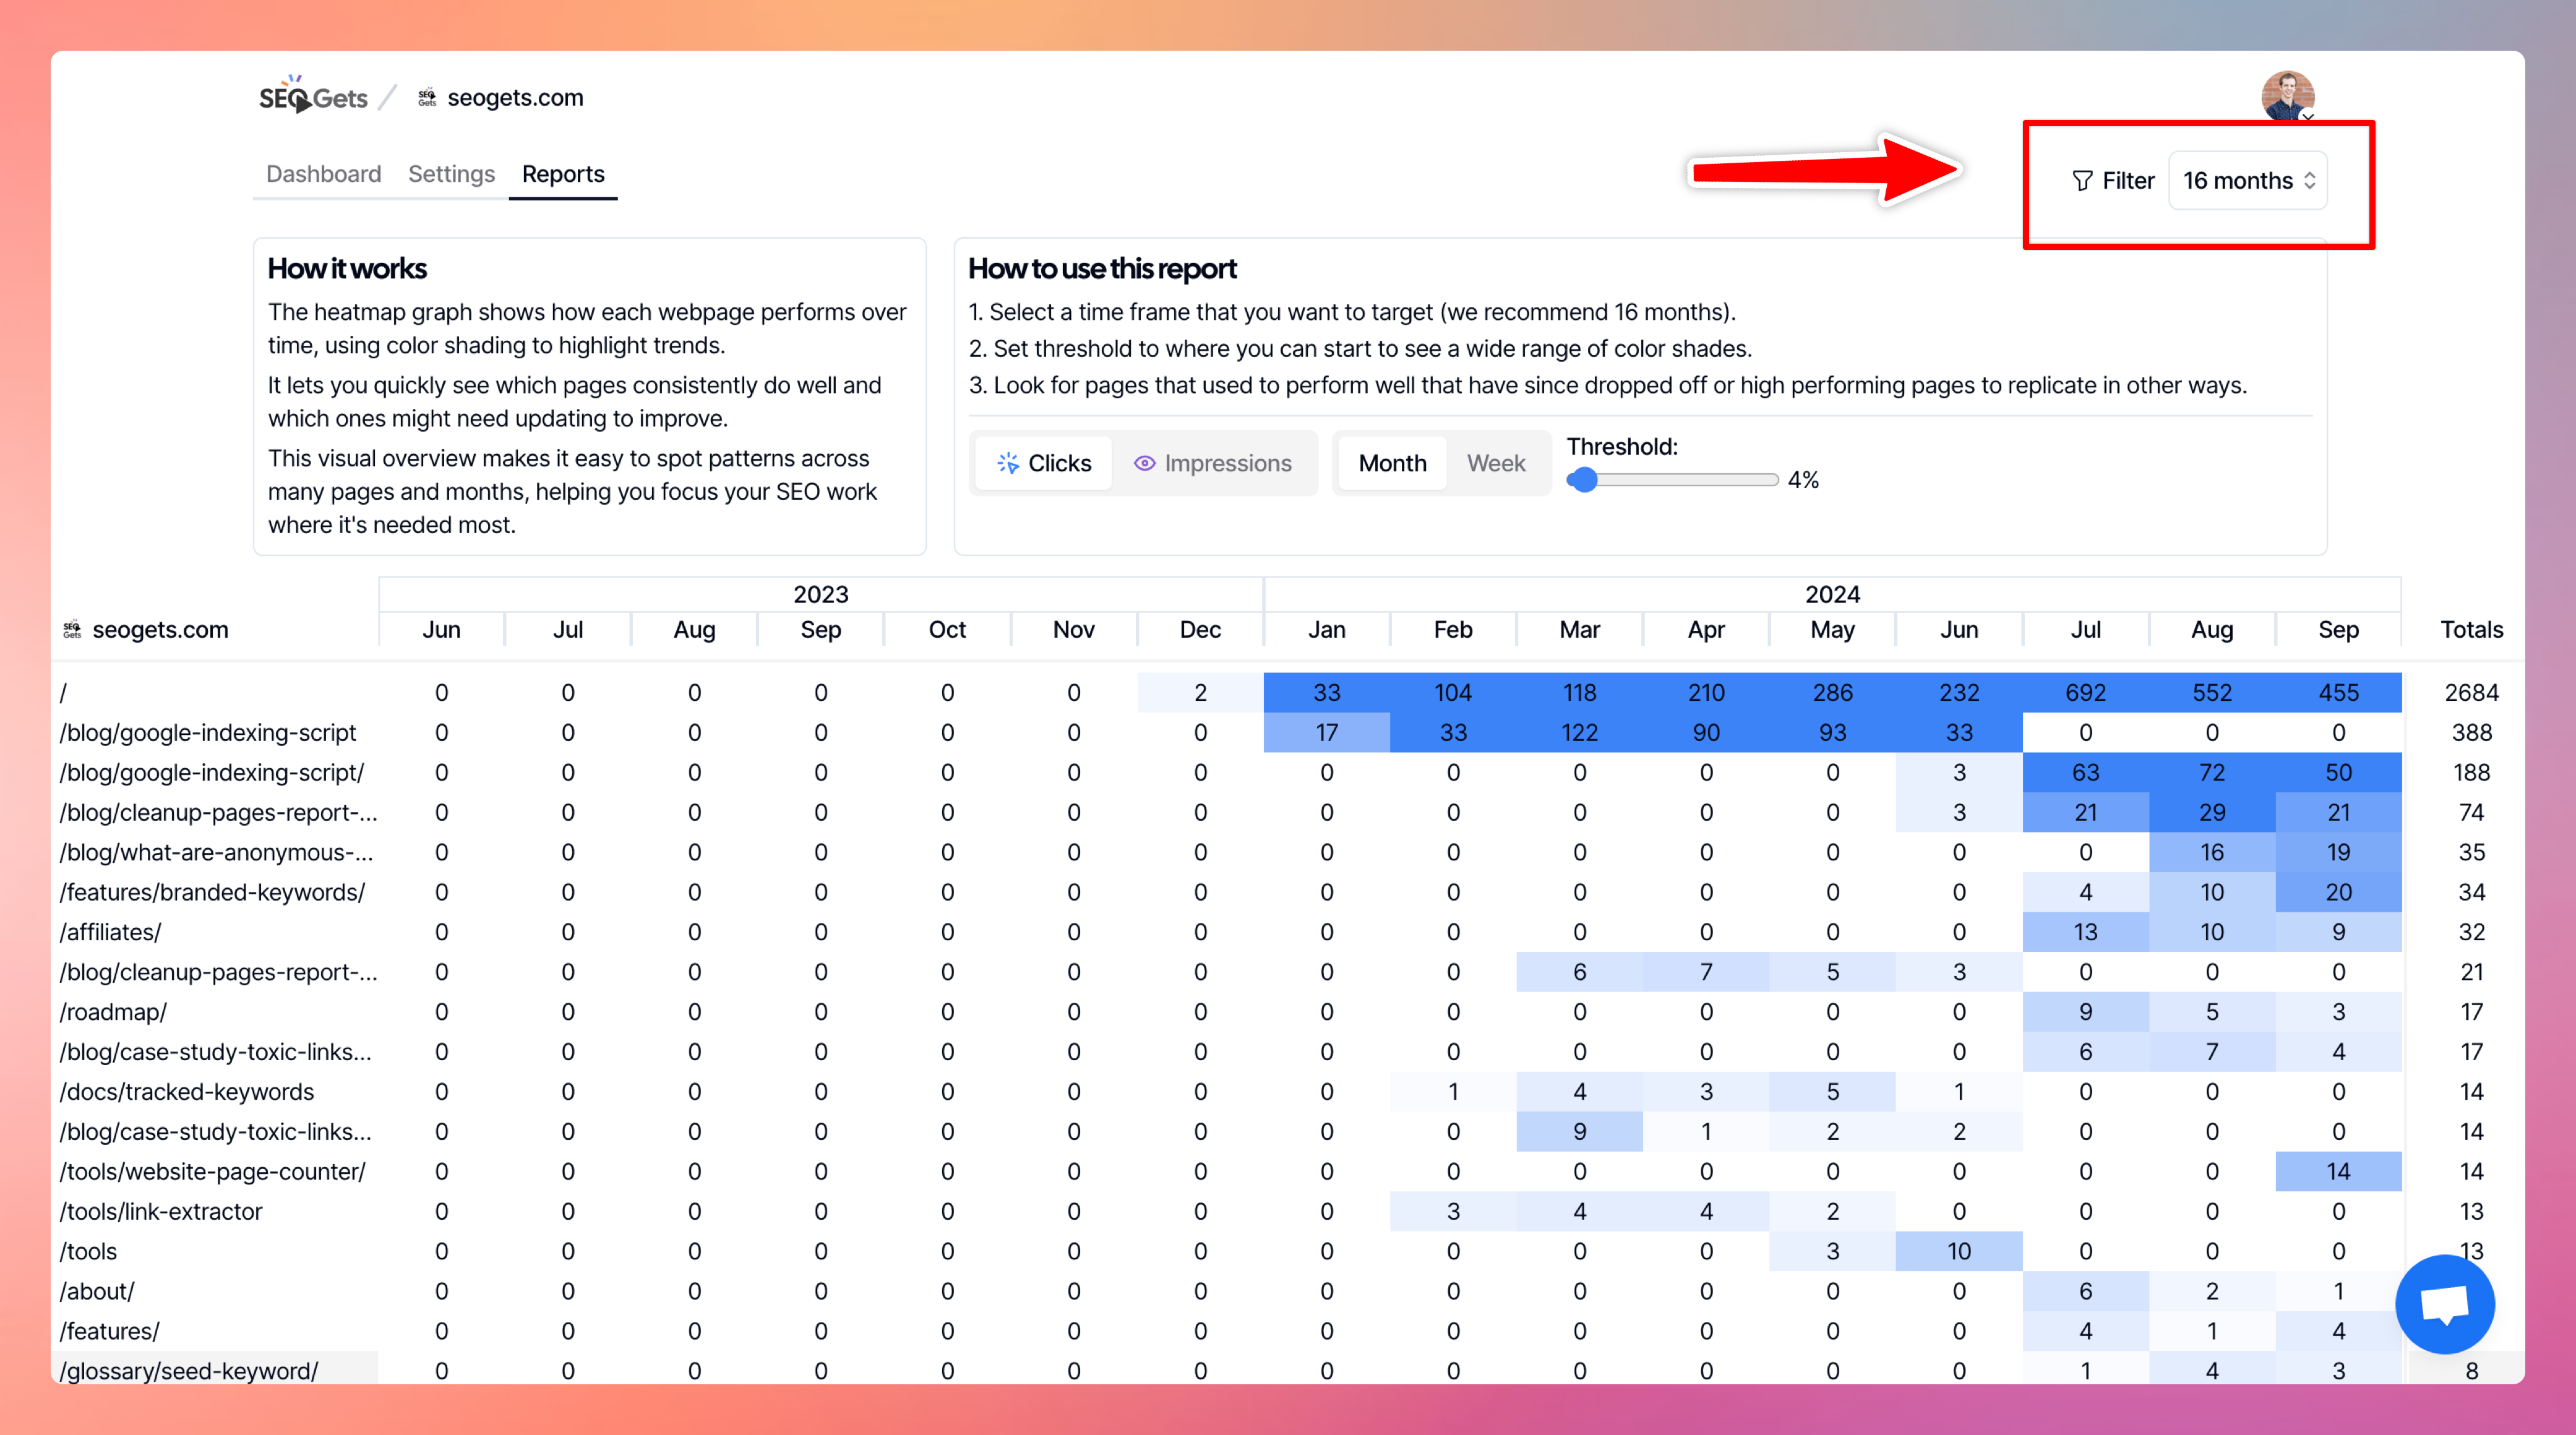
Step 1: Select a time frame that you want to target (we recommend 16 months).

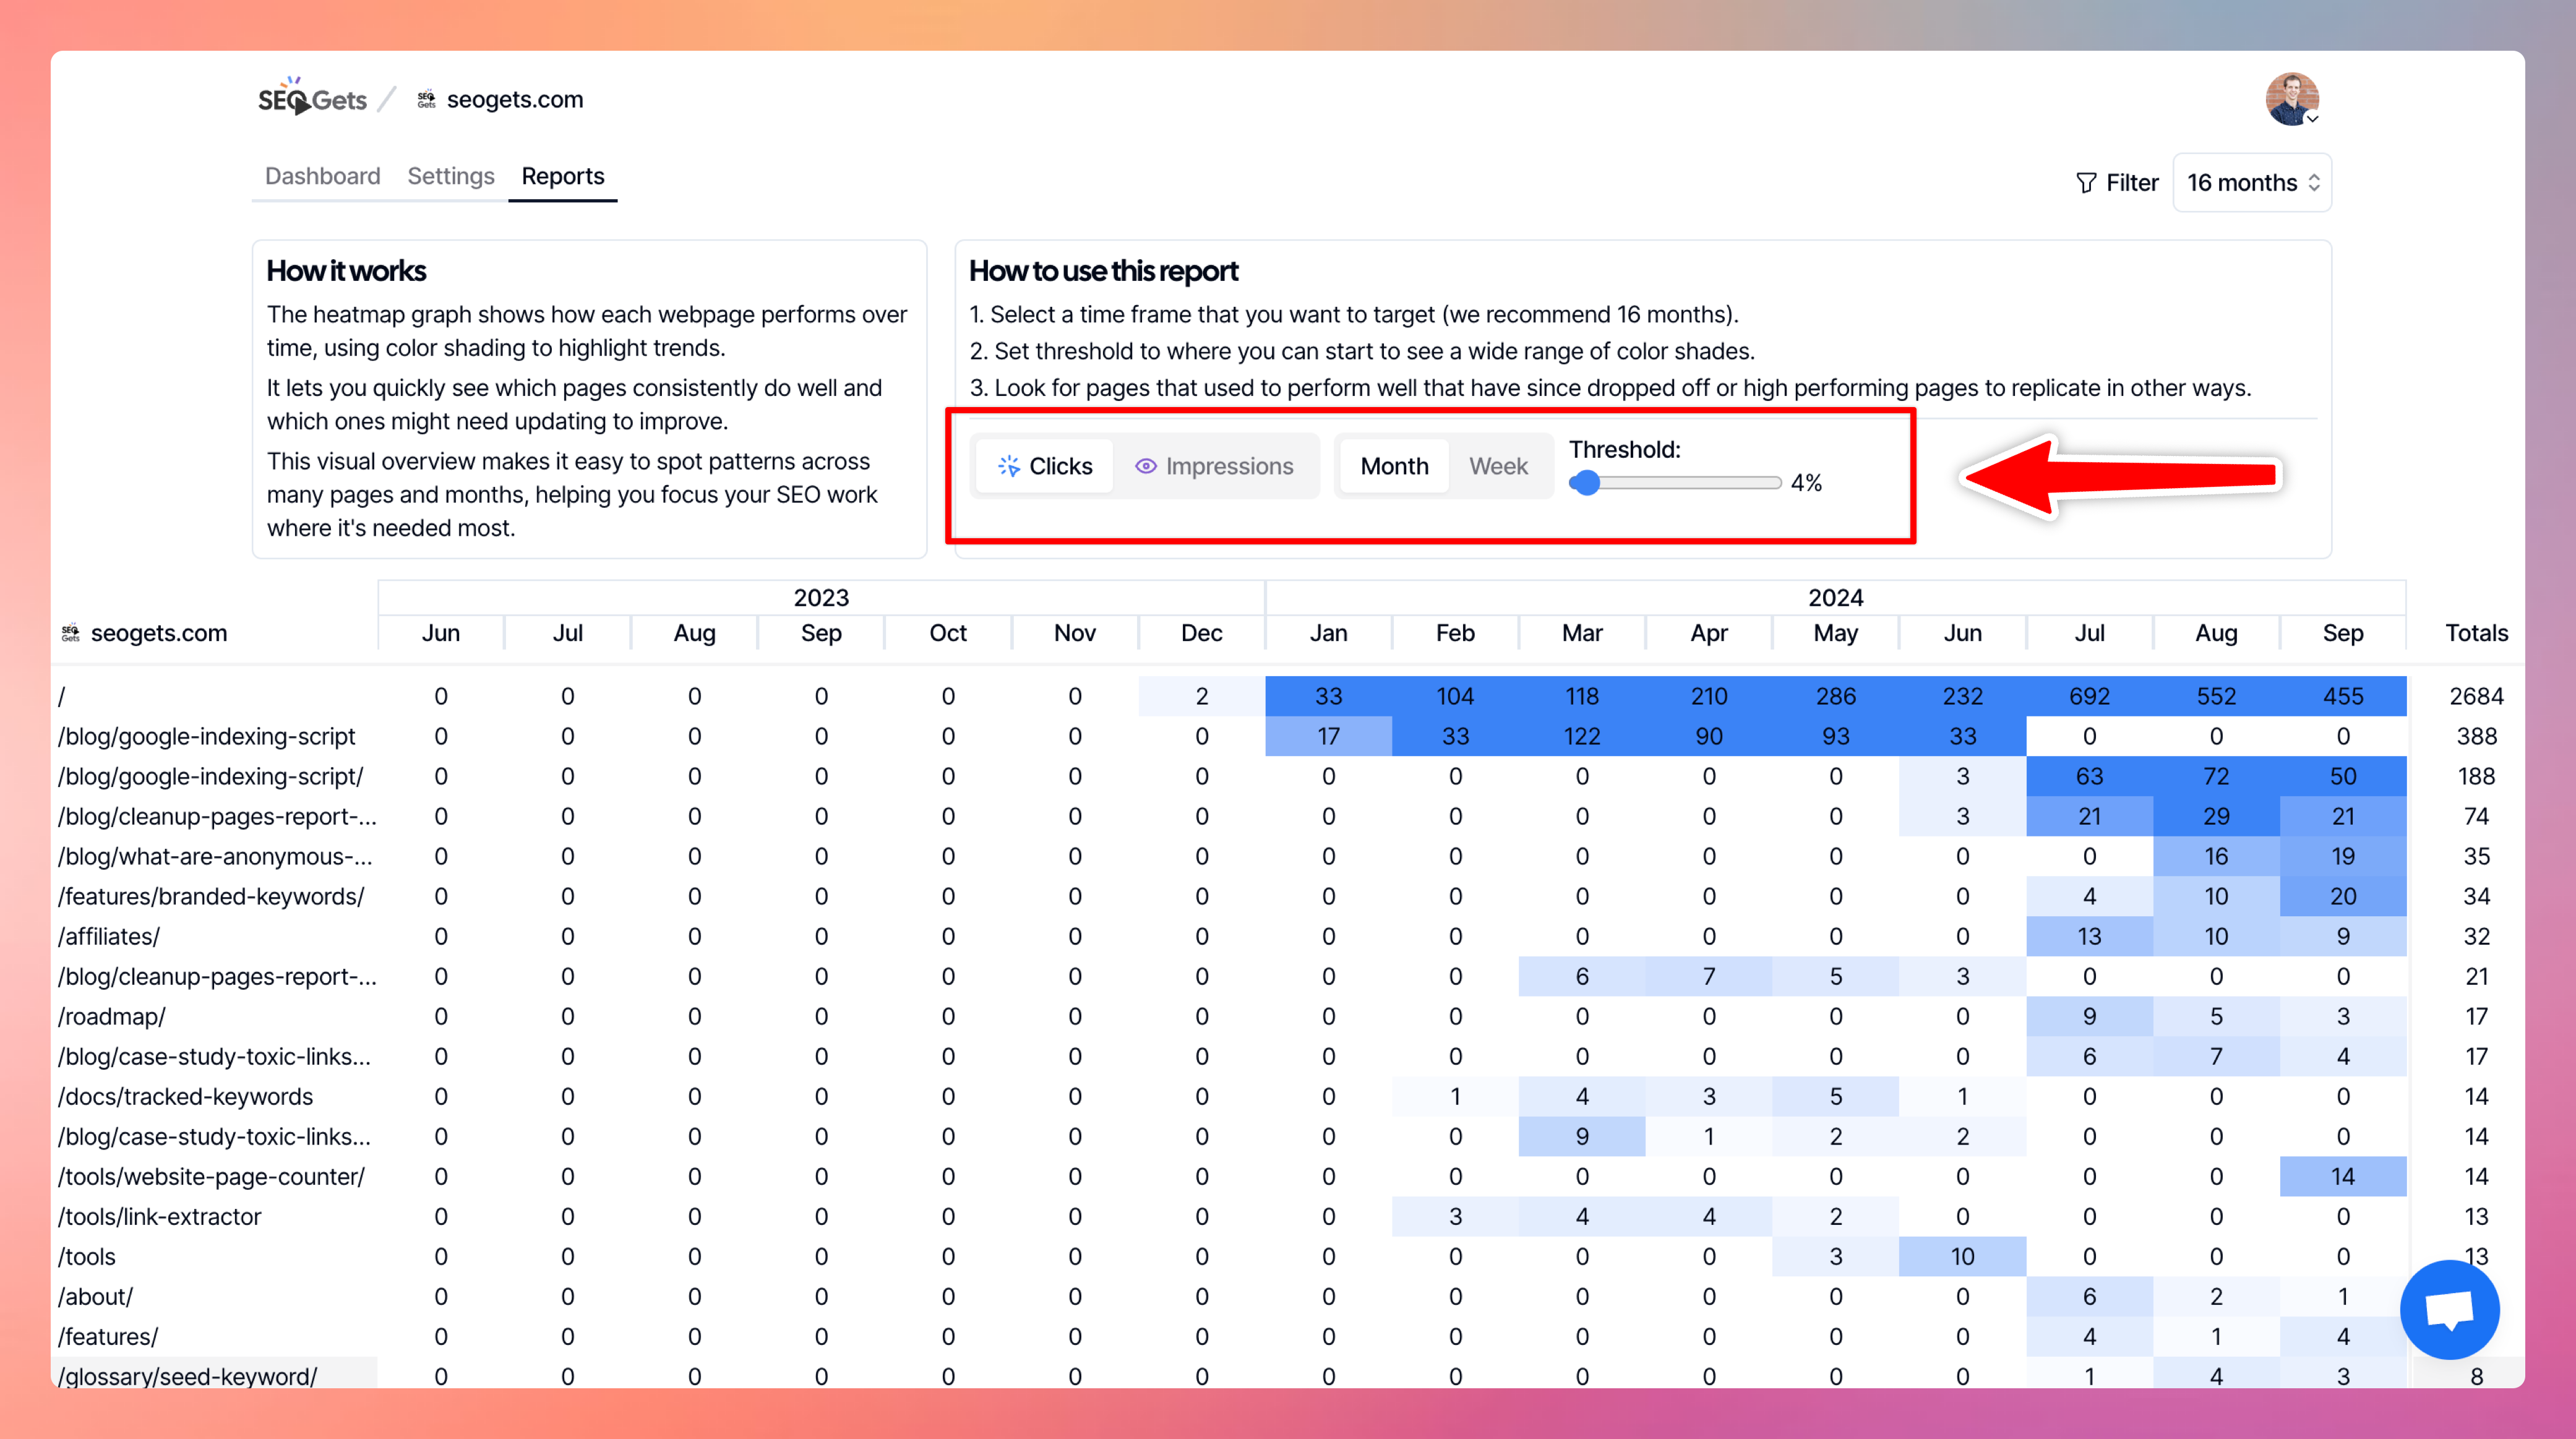
Step 2: Set threshold to where you can see a wide range of color shades.

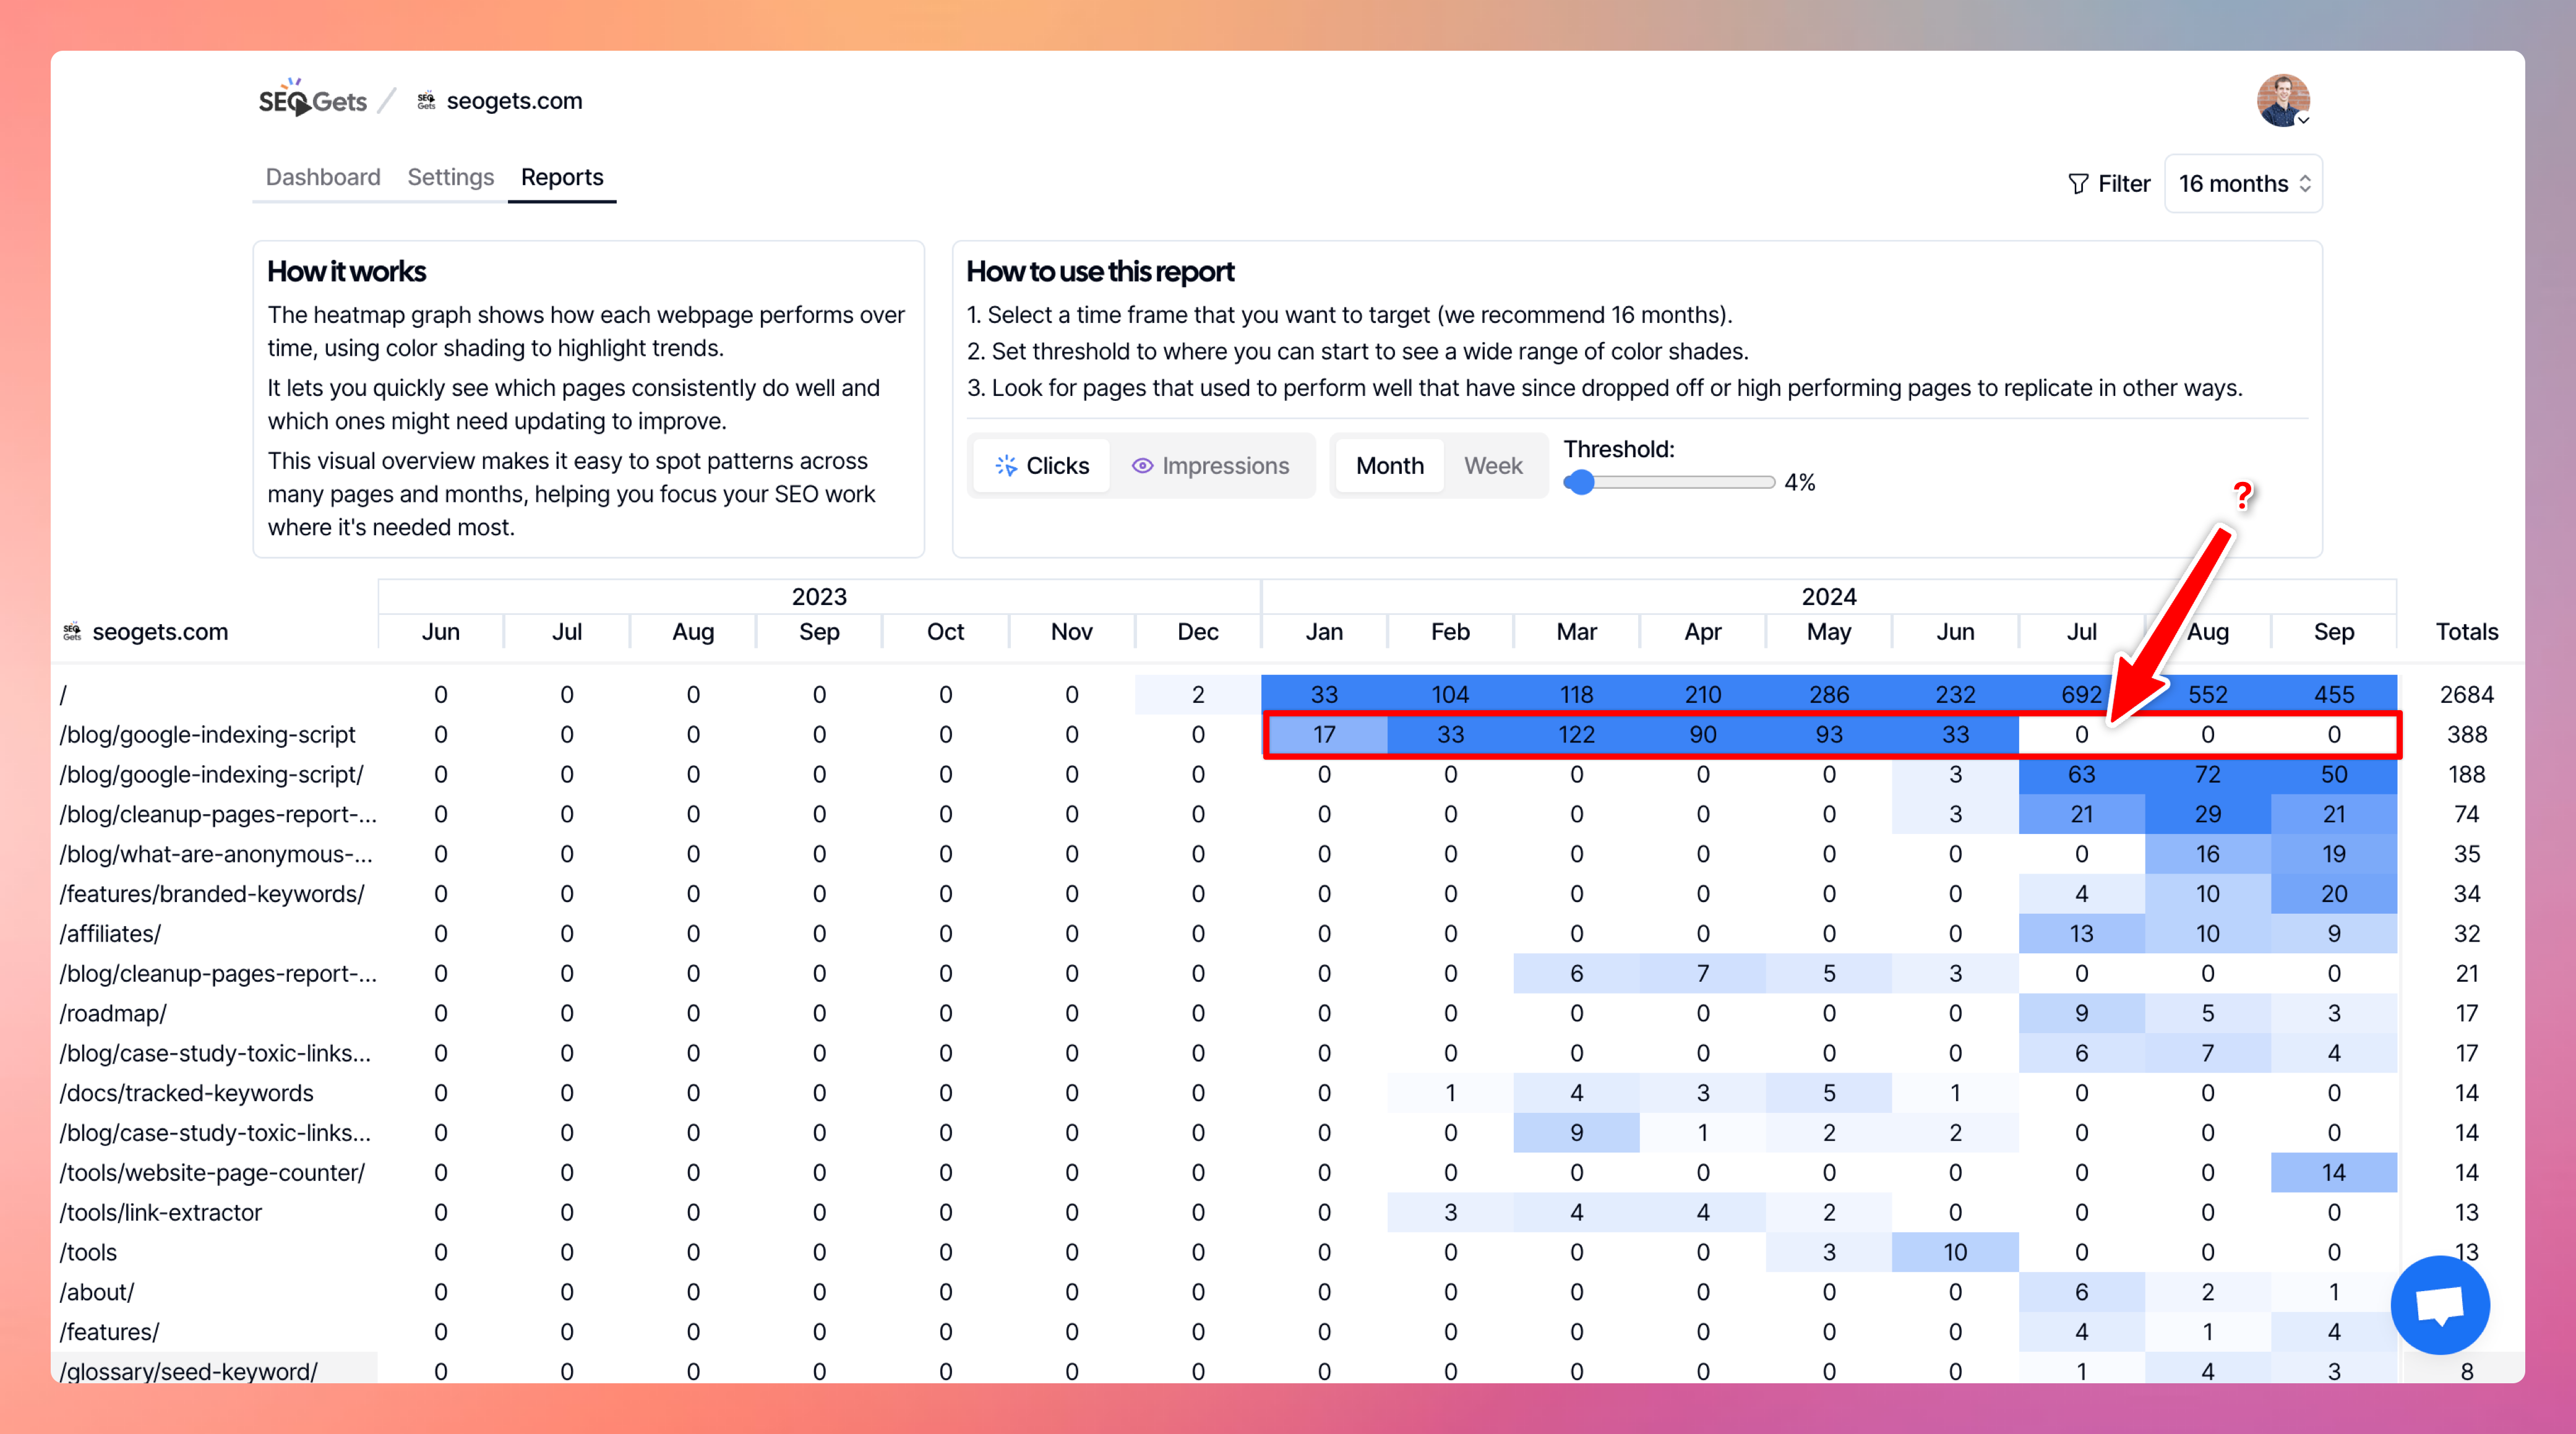
Step 3: Look for pages that used to perform well that have since dropped off or high-performing pages to replicate in other ways.

In this case, the URL went from not having a ”/” at the end to adding it. So in short, nothing was wrong, and we can move on to the next.
How to use the CSV Export in Google Sheets
Try out our Heatmap Overview for free.
I’ve seen striking distance keywords work wonders for countless websites. They’re a powerful tool in your SEO arsenal, offering quick wins and long-term gains.
The best part? You can try it out for free right now. Just head over to our website and sign up for a trial - no strings attached.
Together, these tools can supercharge your SEO performance.
So why wait? Try out SEO Gets today.
✨ Interested in simplifying your SEO analytics workflow? Try SEO Gets for free.
