Site migrations are stressful. You’re moving everything over, doing 301 redirects, and crossing your fingers that Google doesn’t decide to tank your traffic.
The problem is that tracking the migration across two separate domains in Google Search Console is a pain. You’re constantly switching between properties, trying to piece together what’s actually happening.
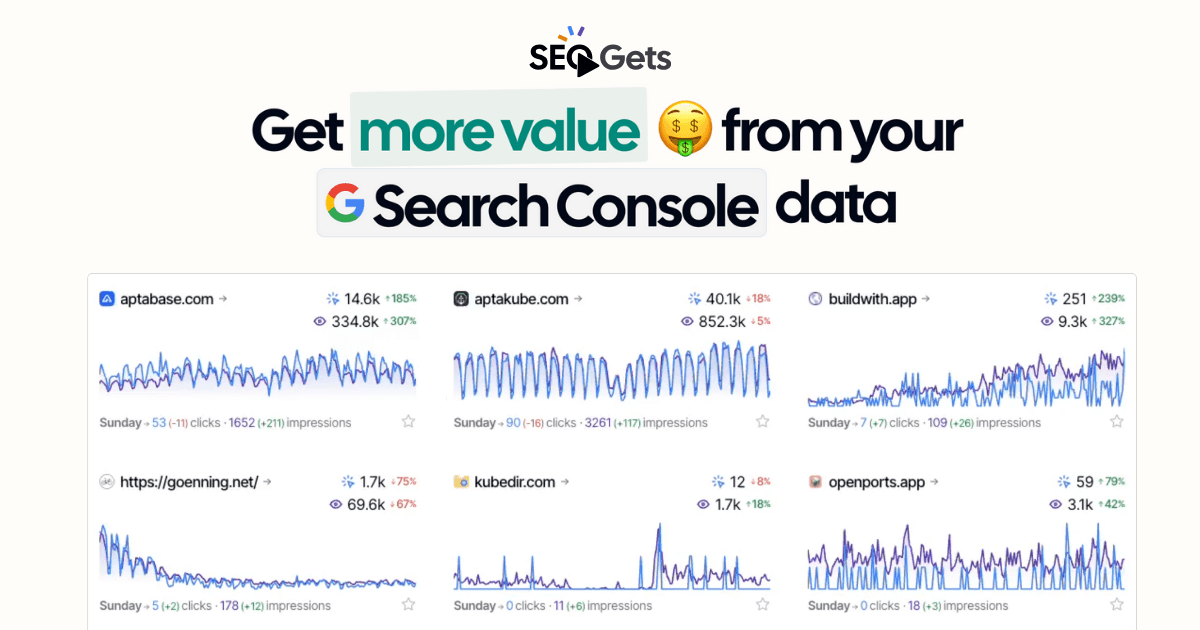
I’m going to show you how to track site migrations in SEO Gets so you can see the complete picture in one dashboard.
Setting Up Your Migration Tracking
The first step is making sure you have both properties connected. Your old domain and your new domain both need to be in GSC (which is automatically added in SEO Gets).
Once they’re both verified, go to the master dashboard and create a tag for them. I usually call it something obvious like “Site Migration - [Client Name]”, but you can name it whatever makes sense to you.
Add both the old domain and the new domain to that tag.
Now when you filter by that tag, you’ll see both domains together in one combined graph.

What the Data Actually Shows
Here’s a real example from a site migration I tracked recently.
This was an HCU site that did a one-to-one domain swap. The old domain got crushed by the helpful content update, so they tried moving to a new domain to see if they could shake the classifier.
When I look at the combined data, I can see exactly when the migration happened. There’s a clear handoff where traffic from the old domain drops off and the new domain picks up.
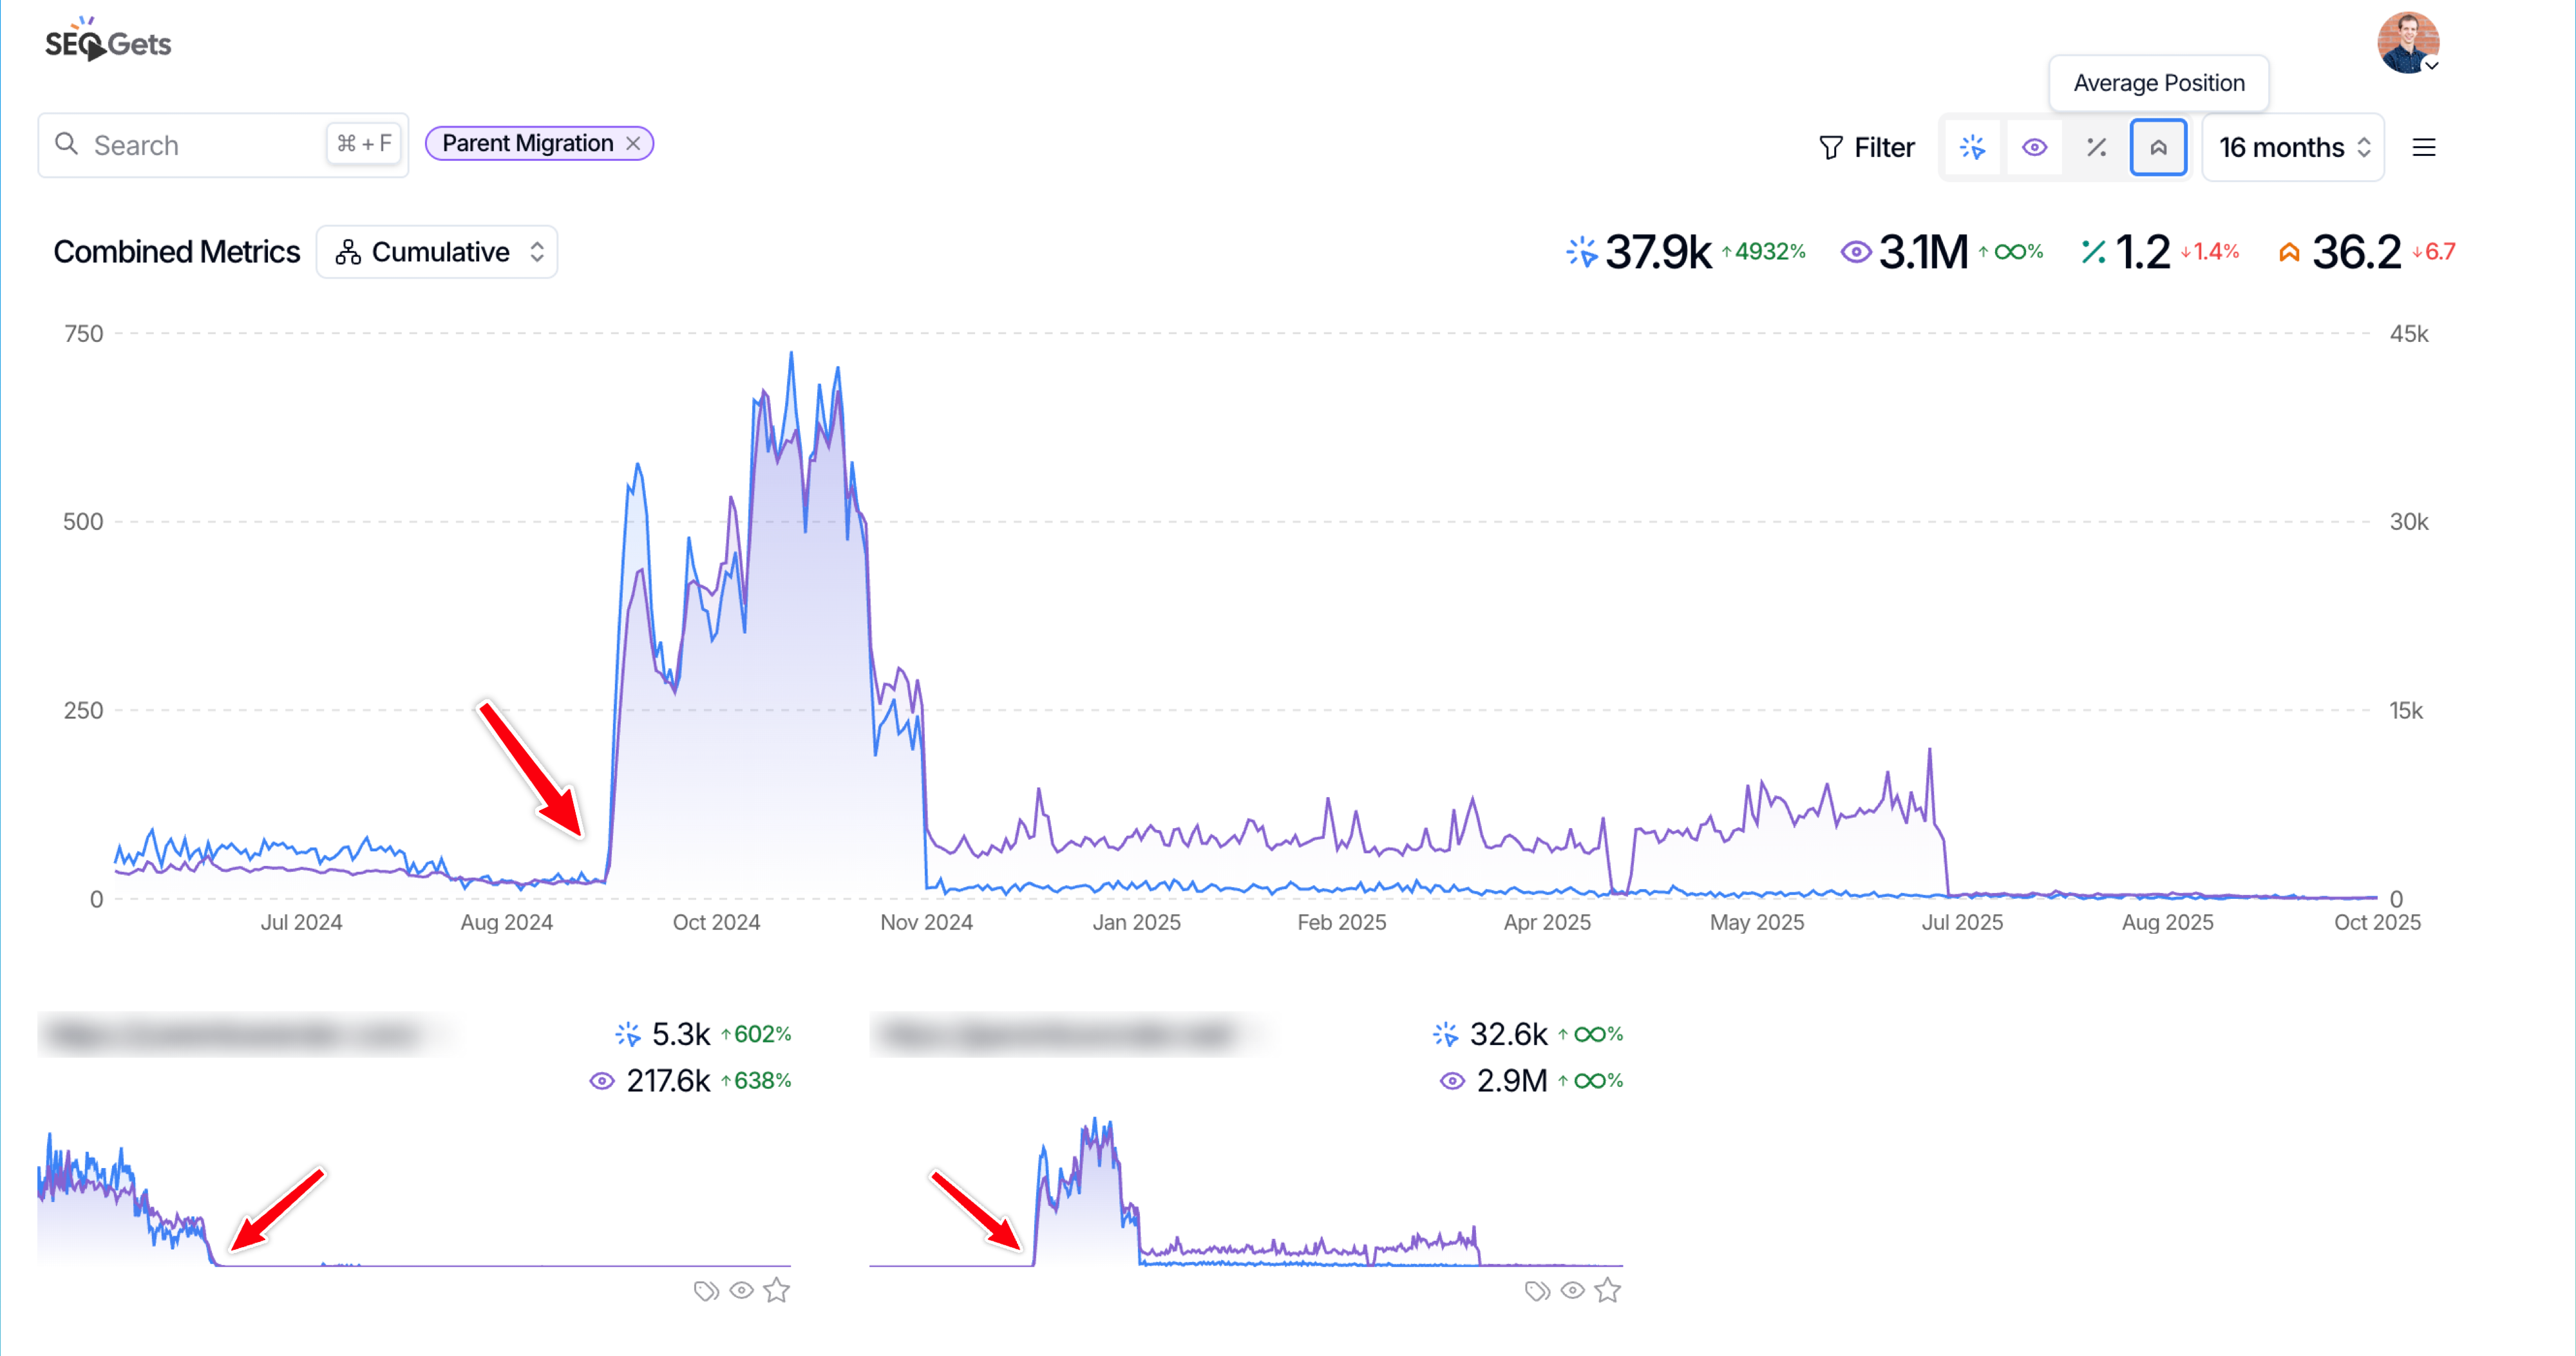
The migration actually went well initially. Traffic came back strong on the new domain.
Then the November core update hit and crushed it again. That’s the experiment risk you take with these migrations.
But the point is, I could see all of this in one view instead of jumping between two separate Search Console properties.
Filtering by Page Type or Content
The real power comes when you start filtering the data.
Say you want to see how your blog pages performed before and after the migration. Just add a page filter for “blog” and you’ll see only those pages across both domains.
Or if you want to check the homepage specifically, filter by the homepage URL.
You can even filter by keywords in the URL. If I want to see how all my parenting-related pages did, I can filter by “parenting” and see those pages before and after the migration.

In this example, when I filtered by parenting content, I could see the migration had a very positive impact on those specific pages.
Smoothing Out the Data
One more useful feature is the time selection smoothing.
Daily data can be noisy, especially during a migration when things are bouncing around. You can smooth the graph out by switching from daily to weekly or monthly views.
This makes it easier to see the actual trend instead of getting distracted by day-to-day fluctuations.

Why This Matters
Site migrations are high-risk moves. You need to be able to see what’s actually happening, not just guess based on incomplete data.
Using a single dashboard to track both domains gives you that complete picture. You can see the handoff, track specific page types, and identify issues faster than jumping between properties in Search Console.
If you’re planning a migration or in the middle of one, set this up. It takes about two minutes and will save you hours of confusion later.
✨ Interested in simplifying your SEO analytics workflow? Try SEO Gets for free.