
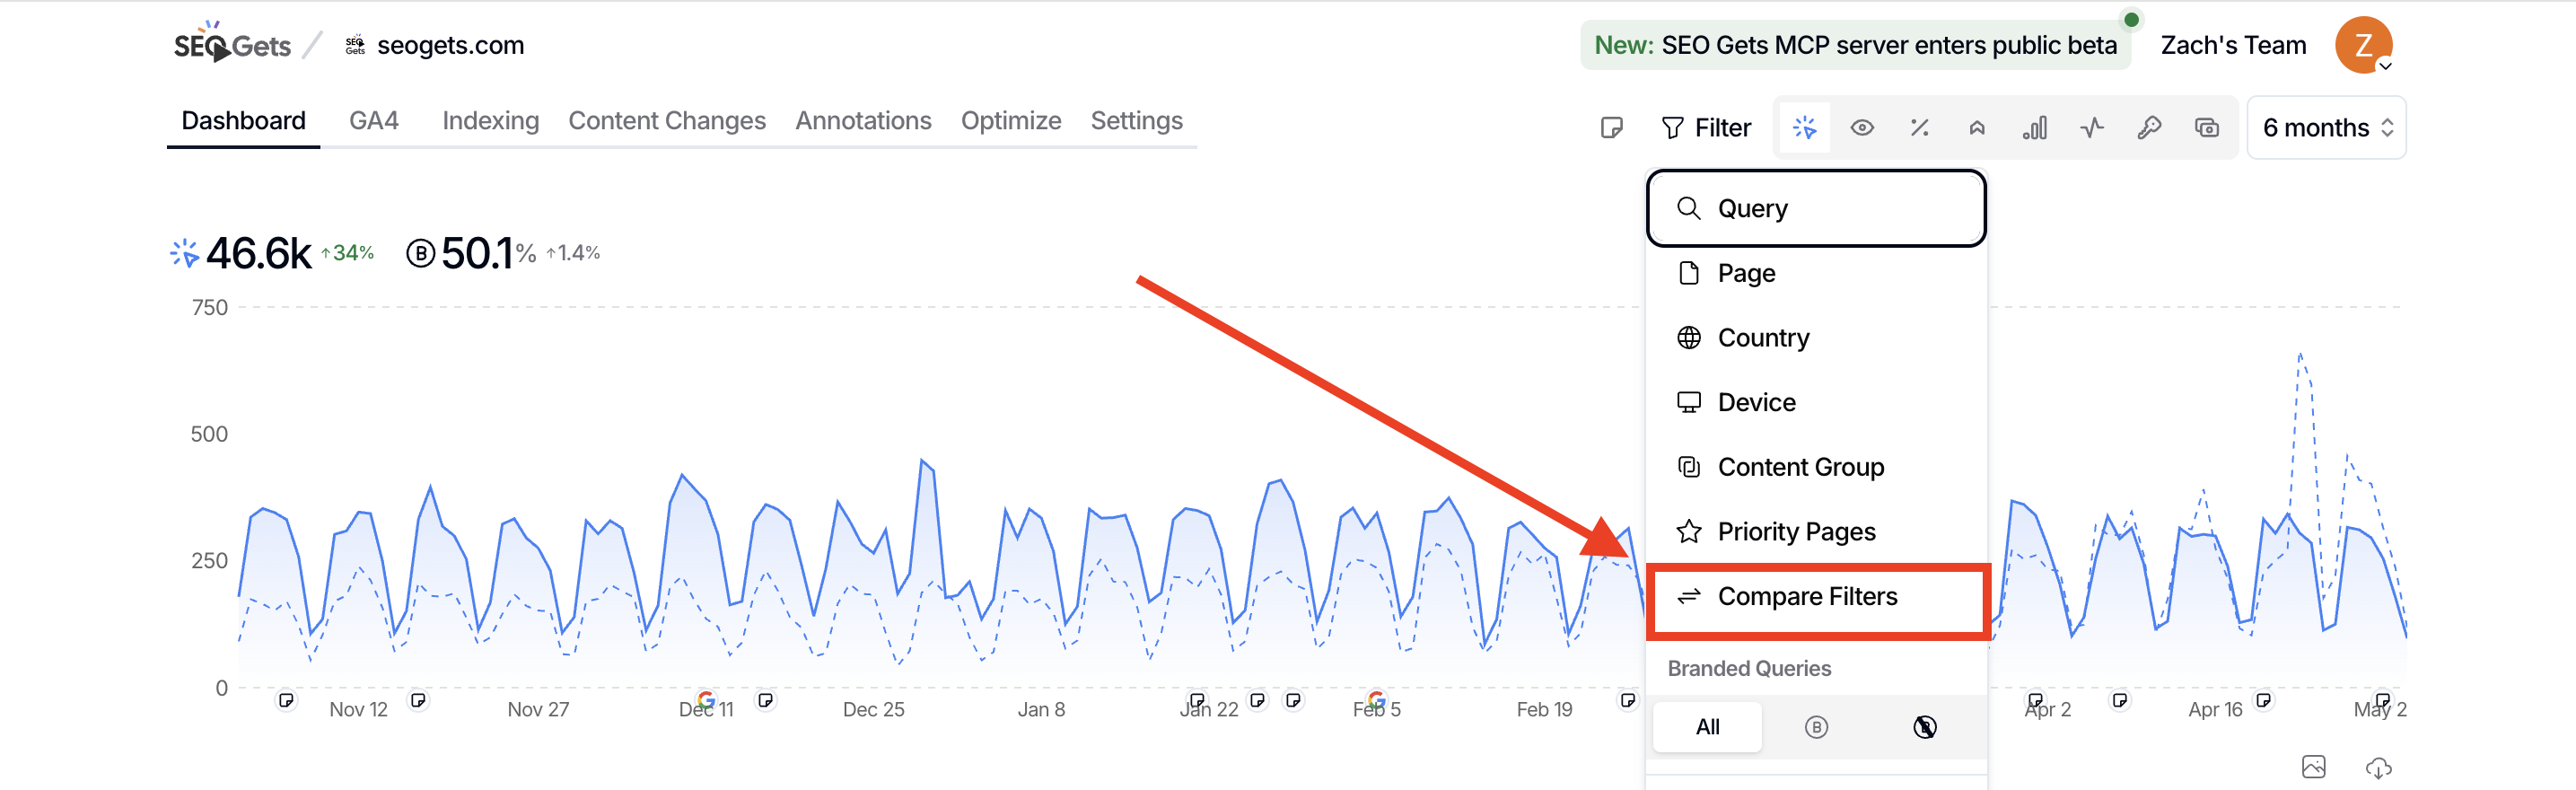
Compare filters
Compare filters let you see how two different segments of your traffic perform side-by-side. Instead of toggling back and forth between views, you can compare things like branded vs. non-branded queries, two topic clusters, or your blog against your product pages—all in one screen.
How to use compare filters
Open the property you want to analyze from your master dashboard.
Click Compare Filters in the filter bar at the top of the dashboard.
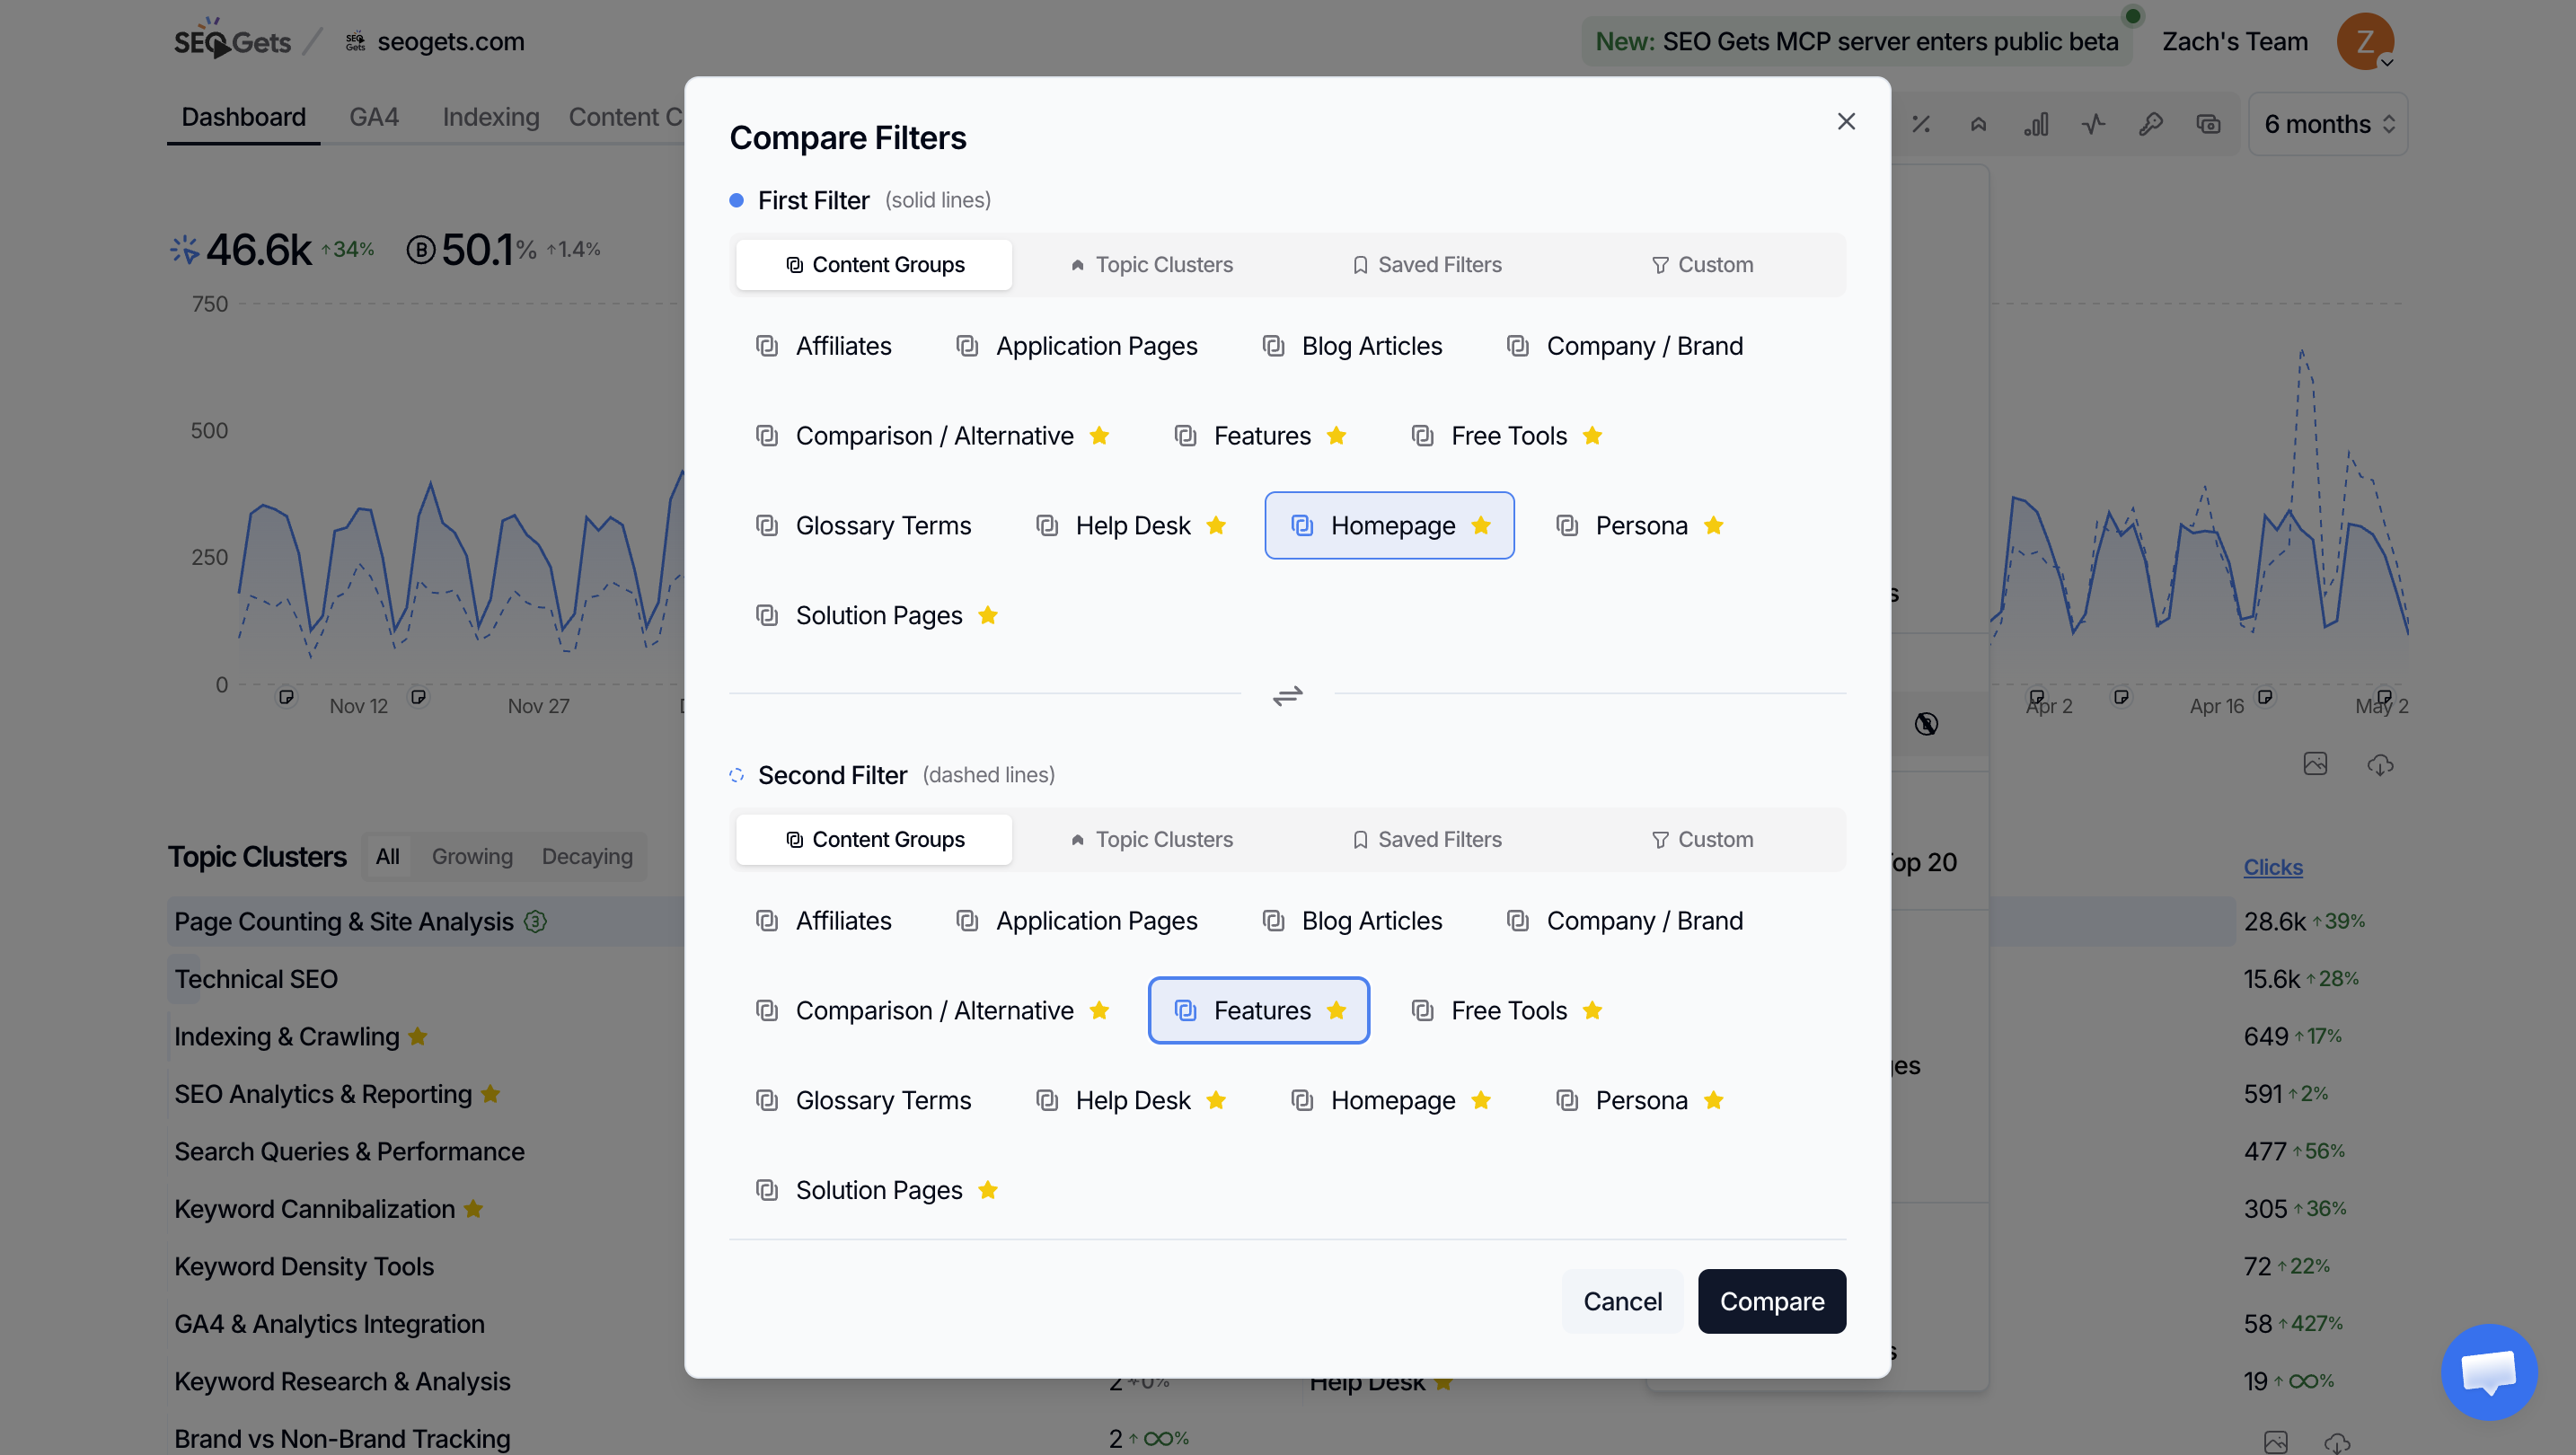
In the dialog, choose your First Filter and Second Filter. You can pick from:
Content — Compare two pages or URL patterns
Topic Clusters — Compare performance across content themes
Saved Filters — Reuse filters you've already created
Custom — Build a new filter on the spot
Click Compare to launch the comparison view.
What you'll see in the comparison view
Once compare mode is active, you'll see a dashboard with both filter sets displayed together:
Daily trend charts — Filter 1 appears as a solid line, Filter 2 as a dashed line
Key metrics — Shows clicks, impressions, CTR, and position for each filter, plus a Diff column
Comparison tables — Key metrics are housed in comparison tables broken out by queries, pages, countries, and devices
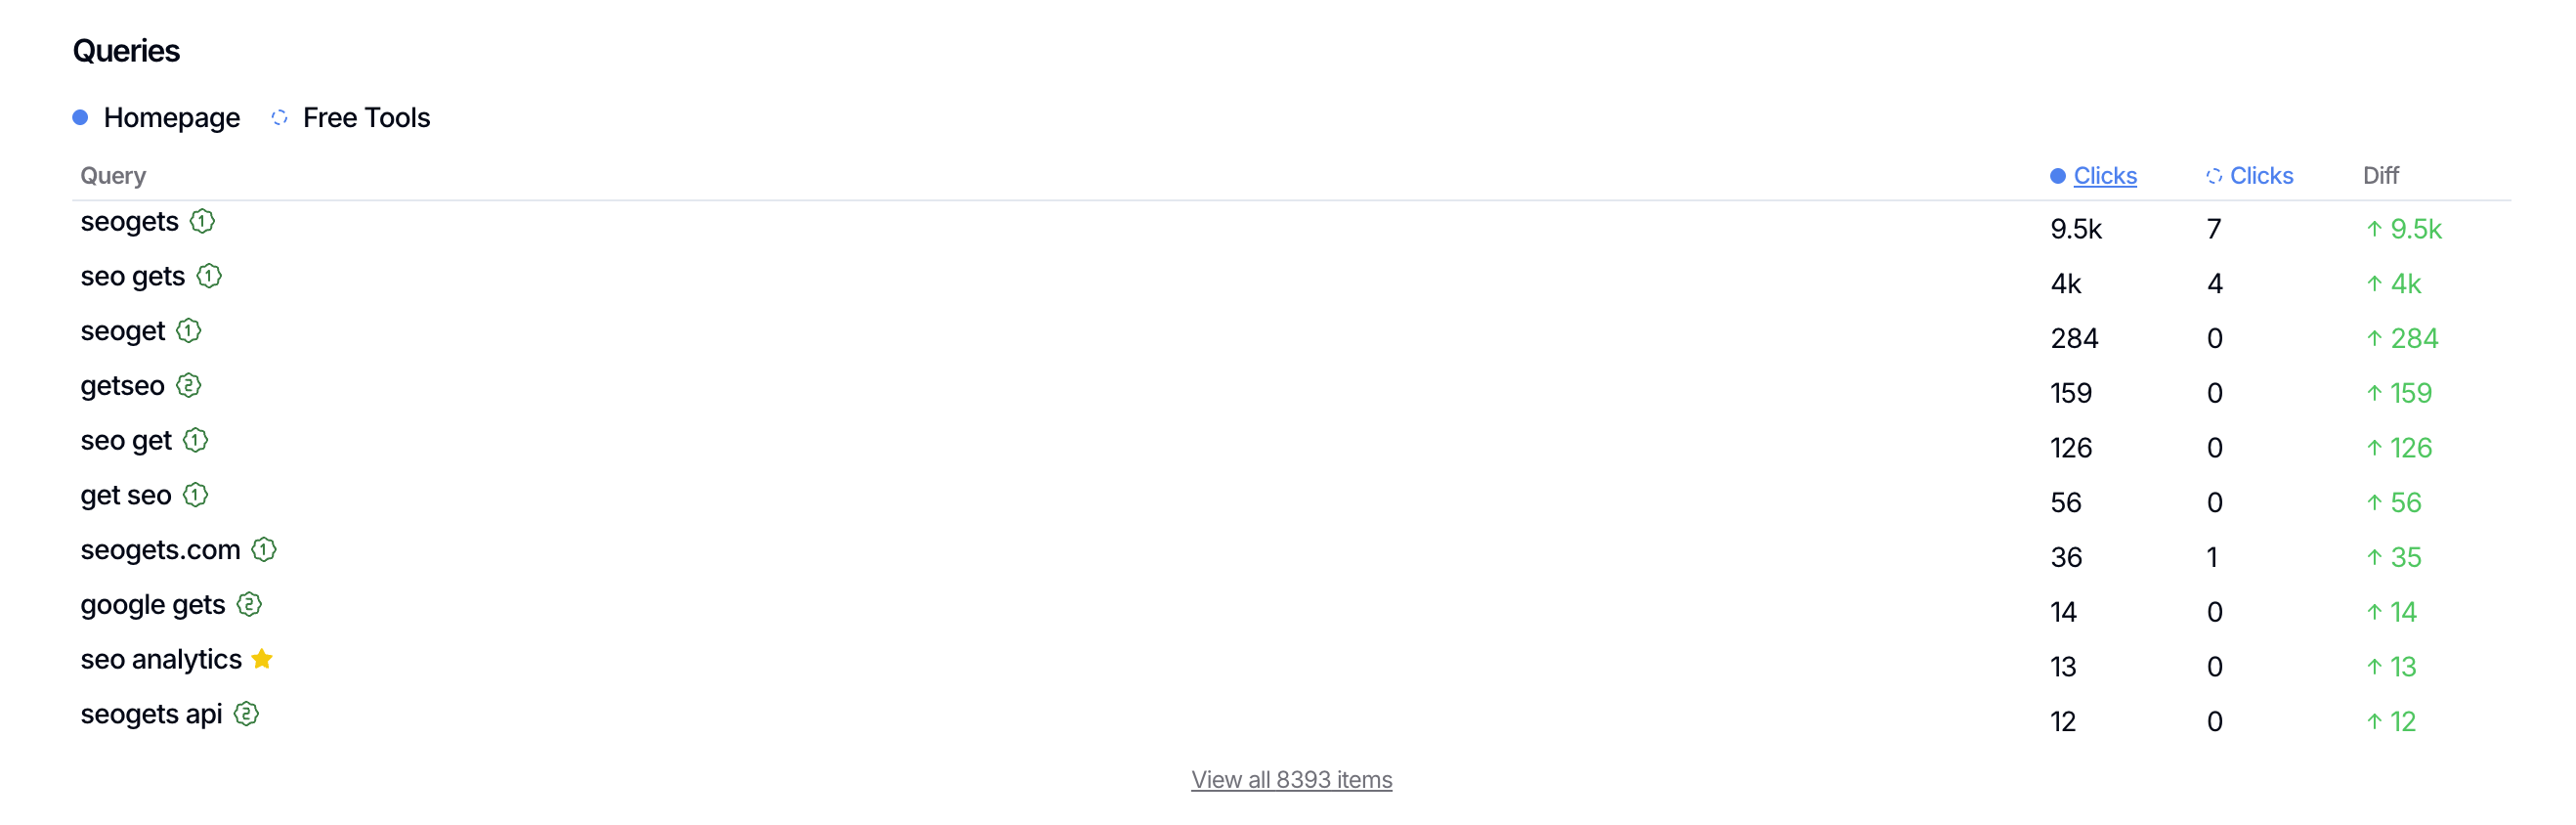
How to interpret the Diff column
The Diff column shows the difference between Filter 1 and Filter 2 for each metric:
Green up arrow — Filter 1 performed better than Filter 2
Red down arrow — Filter 2 performed better than Filter 1
Zero (–) — No difference between the two
For position, the logic flips: a lower number is better. A negative diff means Filter 1 has a better (lower) position than Filter 2, so it shows as a positive outcome.
When to use compare filters
Compare filters shine when you need to understand relative performance across segments:
Branded vs. non-branded — See how much of your traffic comes from brand searches versus organic discovery. Great for reporting awareness vs. acquisition.
Content performance — Compare your blog against your product pages, or two different topic clusters, to see which content drives more engagement.
Geographic markets — Set up filters for different countries and compare performance to prioritize where to focus your efforts.
Device segments — Compare mobile vs. desktop traffic to identify UX or content gaps.
Exit comparison mode
When you're done, click Exit Comparison to return to your standard dashboard view.
What's next
Learn to build and save custom filters so you can quickly reuse your most valuable comparisons.
Explore saved filters to create a library of go-to segments for reporting and analysis.